XAUUSD Daily Chart
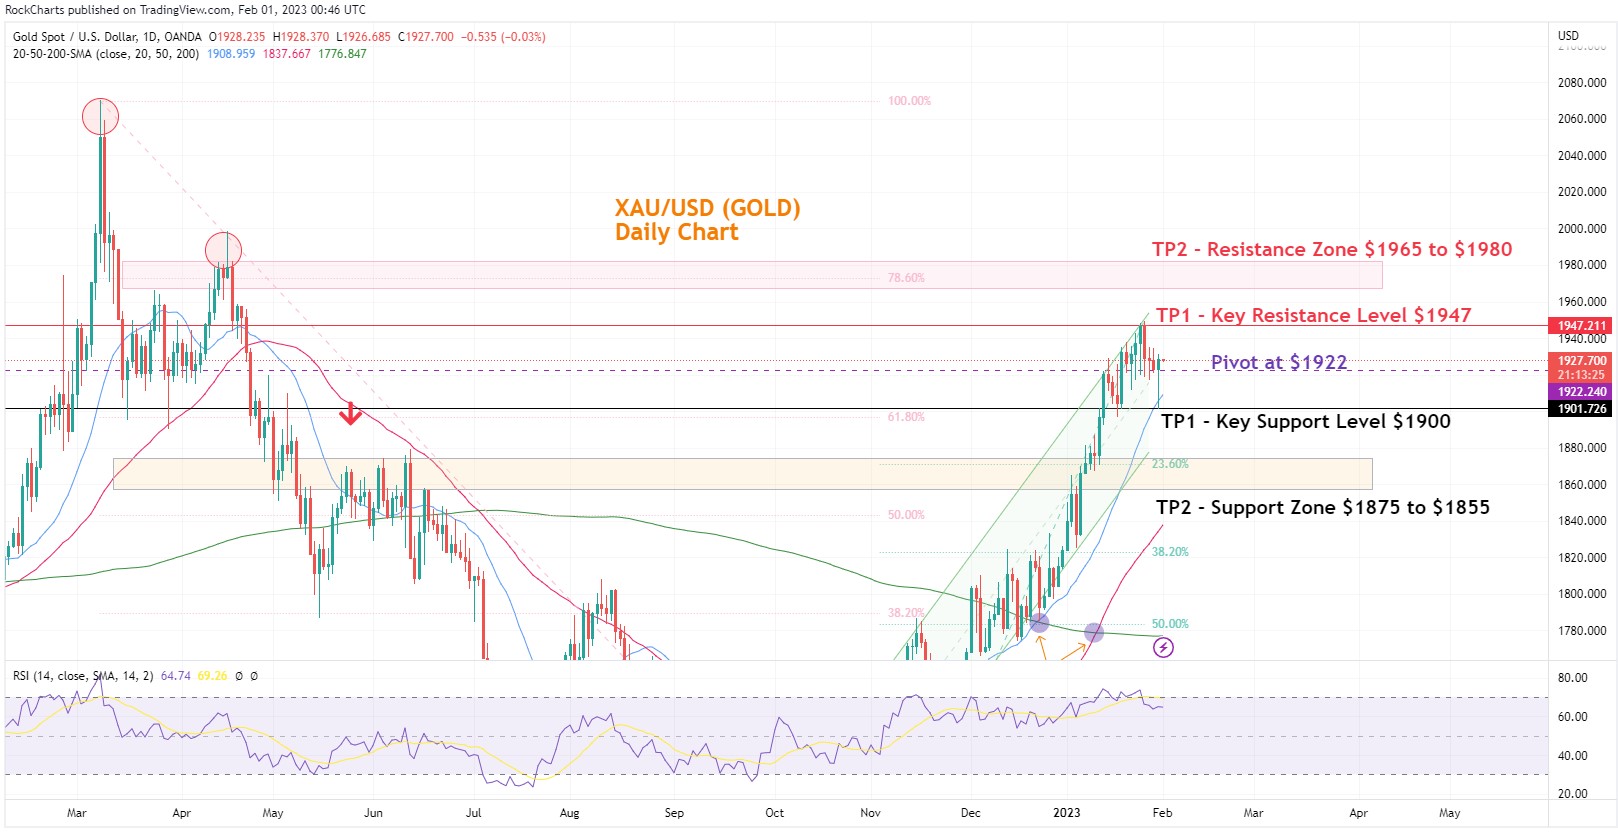
Chart Action Points - XAUUSD Daily Chart
| Action: Potential buy positions above $1922 | Action: Potential sell positions below $1922 |
| Take Profit 1 (TP1) at $1947 | Take Profit 1 (TP1) at $1900 |
| Take Profit 2 (TP2) at $1965 | Take Profit 2 (TP2) at $1875 |
Comments
- RSI Indicator dropped below the overbought 70 points.
- Pair moving up in an ascending channel while prices at the midline support of the channel.
EUR/USD 4 Hour Chart
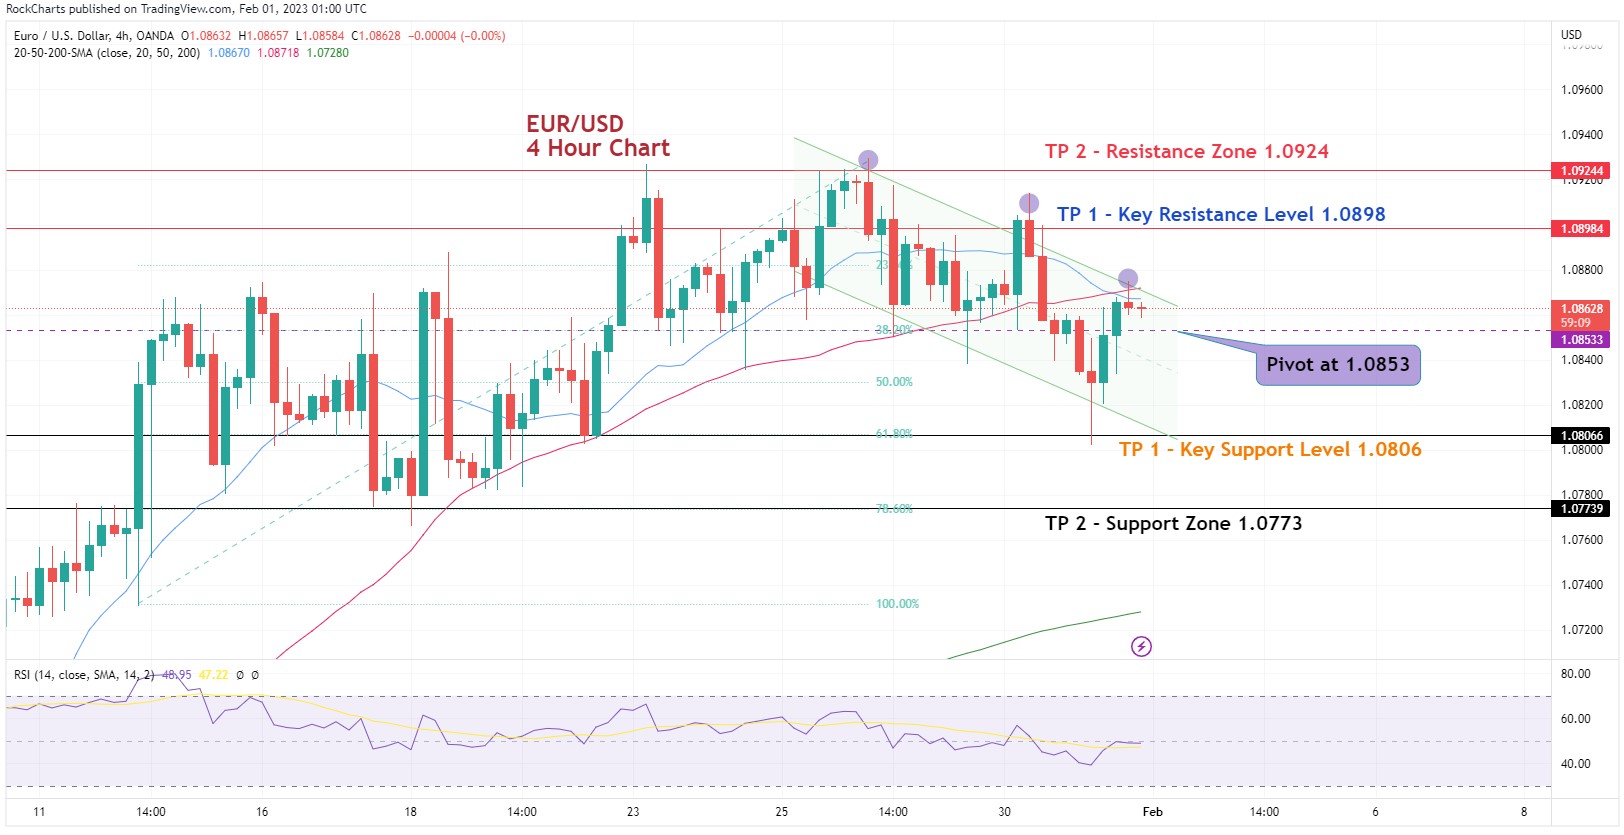
Chart Action Points - EUR/USD 4 Hour Chart
| Action: Potential buy positions above 1.0853 | Action: Potential sell positions below 1.0853 |
| Take Profit 1 (TP1) at 1.0898 | Take Profit 1 (TP1) at 1.0806 |
| Take Profit 2 (TP2) at 1.0924 | Take Profit 2 (TP2) at 1.0773 |
Comments
- RSI needs to move above the midline support for any breakout above the descending channel the pair is in.
- Descending Channel pushing prices down from the ceiling of the channel.