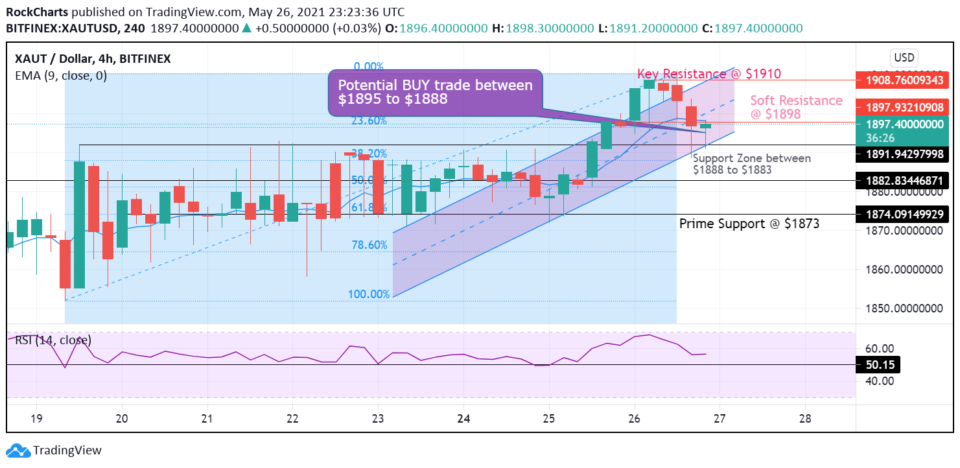
The Chaotic swings of Crypto has pushed investors and traders back into Gold and Silver in the past week. This has prepared the ground for the Gold prices to breach the resistance at $2000 level. As more people look out for inflation hedges, Gold and Silver are going to be the preferred choices. The stock market will enter 10% correction zone before S&P rebounds to move towards 5000 mark. This should contribute to higher gold prices. The hourly chart of XAUT/USD shows that the upward momentum in the Gold prices have begun. The new support zone is between $1888 to $1883. In case of any short-term downward movement the gold should find strong support at around $1873 mark. As of now the Gold price is facing a soft resistance at $1898 and once it is broken the next resistance level is at $1908. As per our chart analysis the chart shows a potential BUY opportunity between $1895 to $1888 levels. Once the Gold retraces back to $1910 mark it should pause for consolidation to move higher from there.


Wall Street Extends Gains on Positive Economic Indicators and Hopes of an End to Fed's Rate-Tightening Cycle