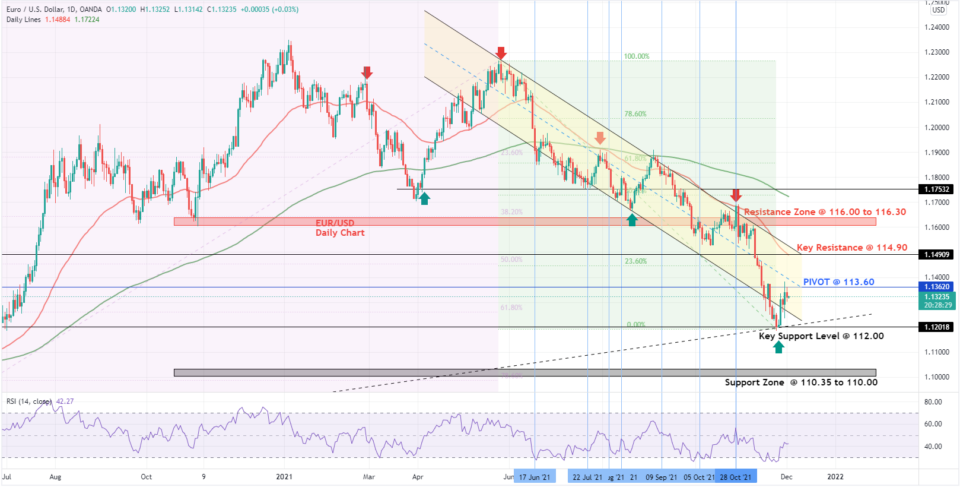
EUR/USD
- Resistance Zone: 116.00 to 116.30
- Key Resistance Level: 114.90
- Major Pivot Point: 113.60
- Key Support Level: 112.00
- Support Zone: 110.35 to 110.00
- Last Analysis Date: Blue Vertical Lines
- 200 Day EMA – Green Line
- 50 Day EMA – Red Line
Trade Insights – EUR/USD – Chart shows viable long positions above the Key Support Level at $112.00, targeting the Pivot at 113.60 and then after consolidation the test of the Key resistance at 114.90. If the push higher is strong, we could also see the test of the Resistance Zone at 116.00 to 116.30.
Alternatively, if the prices drop below the Key Support Level at 112.00 then short positions targeting the Support Zone at 110.35 to 110.00
EURUSD Daily Chart
Chart Analysis:
Directional bias: 2 Weeks EUR/USD
EUR/USD - The chart shows the prices dropped sharply from 115.96 starting 10th November to touch the lows of 112.00 by 24th November. Later throughout the week there was a follow-up recovery as the EUR/USD pair dropped towards the oversold limit of 30 points on the RSI Indicator.
The pair shows that the prices dropped out of the longer-term Bearish channel formed by a multi-month downtrend on the chart but later re-entered the channel and is now testing the Major Pivot at 113.60. It seems there are possibilities of Long Trade and Bulls regaining the control above the Pivot at 113.60. Once this takes place the next Key Resistance is at 114.90 and if this resistance is broken too then we could also see the prices advancing above the Descending Channel and probably to brake-free from this Downtrend channel started in the month of May this year.
If we do not see any decisive move above the Pivot at 113.60 at this stage, then Bears can regain control and push the prices down towards the Key Support Level at 112.00 that can contain any downward push initially. After that, the Support Zone is at 110.35 to 110.00. There is a lot depending on the news of the NFP report on Friday.
The pair is still trading well below 200-day EMA and below the 50-Day EMA level that indicates Bearish Bias of the market. However, the latest recovery in the EUR/USD and the push higher indicates that the pair has found the inflection point already and is now moving higher to recover the losses in the past month and might find the tailwind from the NFP news on this Friday.
Fundamental Overview: US Federal Reserve chief Jerome Powell has hinted at speeding up the Tapering starting as soon as December. He also indicated the risk of persistent inflation has also risen but thinks it will cool down by the second half of 2022. Today, the EU will release the October Producer Price Index while the US will publish November Challenger Job Cuts and Initial Jobless Claims for the week ended November 26. Friday is the day for the nonfarm payrolls report and could cause both rate hike expectations and the dollar to swing wildly.


Wall Street Extends Gains on Positive Economic Indicators and Hopes of an End to Fed's Rate-Tightening Cycle