XAUUSD
Gold prices hovering under $1815; the upside is now finding rejection
- Resistance Zone: $1850 to $1860
- Key Resistance Level: $1831
- Major Pivot Point: $1808
- Key Support Level: $1790
- Support Zone: $1770 to $1760
- 200 Day EMA – Green Line
- 50 Day EMA – Red Line
Trade Insights – 1808 level seems to be serving as a major pivot point at this stage. Viable Long positions above $1821 level targeting the key resistance at $1831 and then $1850 the major resistance zone.
Alternatively, If the prices fall below the $1808 level, traders could take short positions as sellers may retest $1790 and then $1770 support levels.
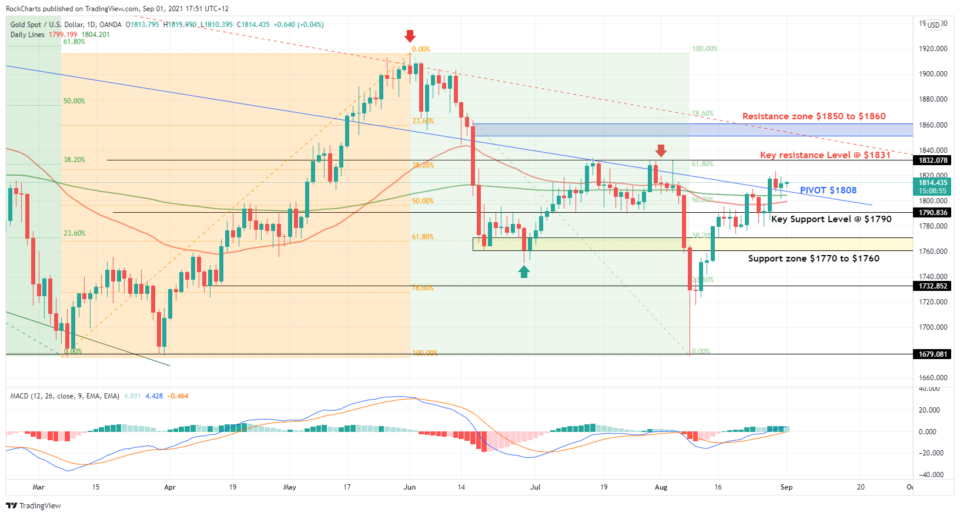
XAU/USD Daily Chart
Chart Analysis:
Directional bias: 1 Week XAU/USD
Technical Analysis of XAU/USD daily chart shows that after climbing sharply up from the lows of $1677 to touch the peak at $1823 the prices are now finding strong rejection under the $1820 psychological level. However, the prices are trading just above the 200 Day EMA line, and the 50 Day EMA line still indicating a Bullish trend so far. There are indications that the prices could move in a downward direction from here as the upward move was over-extended. The Dollar index DXY has fallen back below the crucial 93.20 level and now consolidating to retest the solid resistance. The gold chart analysis further shows that the Pivot is at the $1808 level and prices are for now managing to stay above this level. If we see any move above the $1821 level, then the Gold Bulls may target the $1831 key resistance level which has proven twice to be a very strong barrier for the gold prices in the month of July.
The RSI and the MACD indicators show that a move higher is possible however if the prices move lower below the Pivot of 1808 then we can see a further drop towards $1790 which seems to be a key support level in the chart. Any further weakness could push the prices towards the $1770 Support cluster.
Fundamental Overview: Gold prices climbed sharply in the last week and the Bull run is now losing its steam after Jerome Powell’s address on Friday, last week at the Jackson Hole Economic conference in which he reiterated the wait and see approach and mentioned there could be an Interest rate hike this year. An important data release to watch out for is the August Jobs Report due on Friday this week. The market consensus for August is the NFP numbers can drop as compared to July’s strong numbers.
XBT/USD
- Resistance Zone: $50500 to $51000
- Key Resistance: $48200
- Major Pivot Point: $45500
- Key Support: $43900
- Support Zone: $40000 to $41000
- 200 Day EMA – Green Line
- 50 Day EMA – Red Line
Trade Insights – Viable Long Positions above the Pivot Point of $45500, first targeting the Key resistance at $48200 and then the Resistance zone at $50500 to $51000.
Alternatively, If the $45500 key level is broken then, possible Short positions towards the first support level at $43900, and then prices could fall towards the support zone at $40000 to $41000
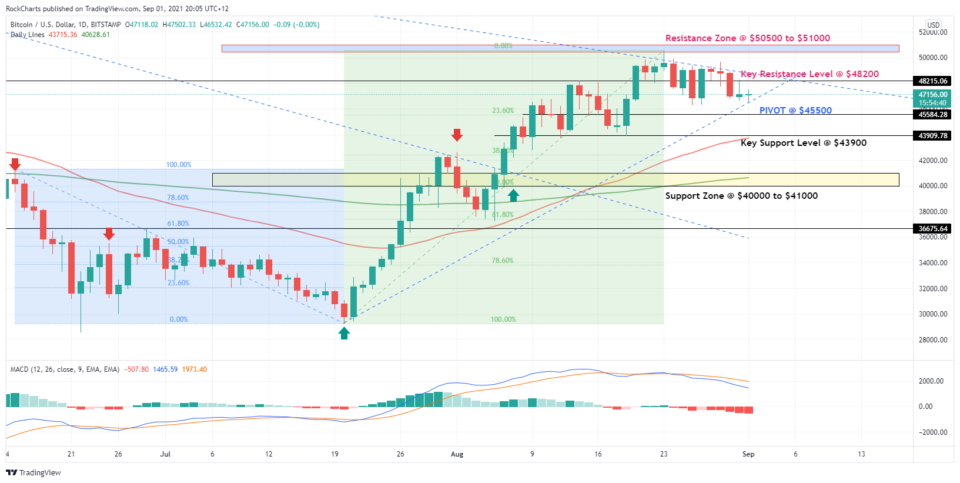
XBT/USD Daily Chart
Chart Analysis:
Directional bias: 1 Week XBT/USD
Since our last analysis on the XBT/USD pair has experienced a strong rally, where the prices have broken the previous Resistance zone at $42500 and moved sharply higher to briefly touch the $50500 mark and now consolidating under the Key resistance level of $48200. The prices could fall from here to first touch the Pivot at $45500 and then a possible retest of $48200. If the $48200 level is broken, we could see another attempt to break the supply zone at the $50000 mark, and this continuation of uptrend seems unlikely at this stage.
For now, the prices are consolidating well above the 200 Day EMA and the 50 Day EMA confirming the uptrend. However, apparently, the prices found a strong resistance around the psychological mark of $50000 and are now sliding downwards indicating a possible reversal in the trend. If the prices could not hold above the $45500 Pivot point, then we could see a sharp downward move towards the key support level at $43900 and then with a further weakness towards the crucial Demand zone at $40000.
Fundamental Overview: The Peoples Bank of China has said the Bitcoin has no “Actual Value” and has shut down many companies engaged in the trading of Crypto Currencies. This has not led to any noticeable decline, however, these recurring attacks on Cryptos by the governments, regulators, and Central banks show that a global war is going on between Digital currency and Fiat currency. Bitcoin mining has become difficult due to the rising rig numbers, but the investor sentiment still seems buoyant. For now, we see BTC has struggled to move higher above the $50K mark and consolidating near the $4700 level.


Wall Street Extends Gains on Positive Economic Indicators and Hopes of an End to Fed's Rate-Tightening Cycle