- GBP/USD
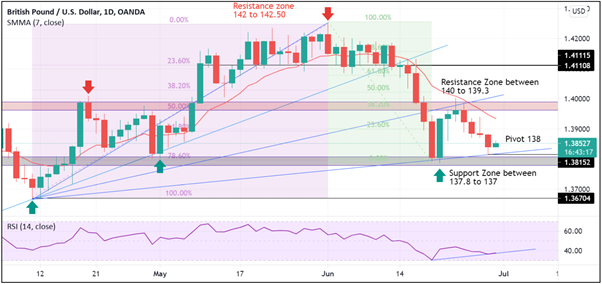
- Resistance Zone: 140 to 139.3
- Support Zone: 137.8 to 137
- Key Support: 119.84
- Pivot: 138.8
Trade Insights – Viable Long positions above 138.8 with the target of 140. Alternatively, Short Sell below 138.3 with the target of 137 and then re-enter for the long position with the target of 138.3.
GBP/USD CHART
Chart Analysis:
Directional bias: 2 Weeks EUR/USD
THE GBP is the fourth most popular traded currency and third most held reserve currency. Technically the GBP/USD chart is looking weak. After hitting the resistance zone at 140 to 139.3 the pound retreated as USD climbed up. We see the support zone is at 137.8 to 137 and if this is broken in next few weeks then we have the next support at 136.7 to 136. However, if GBP breaks the Pivot at 138 then we can see another test of the resistance zone. We recommend caution and use of limits while trading on the currency pair.
Fundamental summary: GBP can suffer further if UK travellers face restrictions in the EU. Angela Merkel is currently pushing EU wide restrictions of British travellers due to concerns about the Delta variant of Covid 19 first discovered in India. GBP/USD IG Client sentiment shows traders are now at their most net long since Apr 12.
XAU/USD
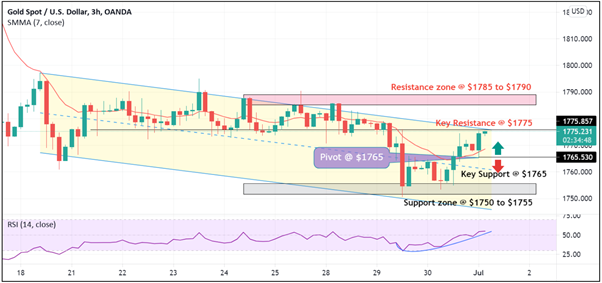
- Resistance Zone: $1785 to $1790
- Key Resistance Level: $1775
- Support Zone: $1750 to $1755
- Key Support: $1765
- Pivot: $1765
Trade Insights – Viable Short positions below $1765 with the target of $1760 and then $1750. If $1750 is touched again, then a long trade to the next resistance of $1865. Alternatively, if Gold goes strongly above $1765 then we can enter long trade with the target of first $1775 and then to $1790. If the sell-out continues then the next support is at $1721.
GOLD/USD CHART
Chart Analysis:
Directional bias: 1 Week GOLD/USD
Safe heaven metals gold and silver saw the biggest monthly drop in more than 4 years since 2016. In the latest trading session, the resistance at $1778 proved decisive as the selloff smashed gold to $1750. In the late recovery rally Gold recovered to hit its resistance at $1765. As of now the Gold USD pair is sitting at $1775 strongly above the key support level. The chart shows that the Support has shifted higher between $1750 to $1755. If this support zone is broken, then the next support is at $1721. The Pivot is at $1765 as this point will get to decide which way gold is heading. If bulls can manage to push Gold beyond $1765 then we can see a rally towards $1775 and with further strength towards $1790. If bears remain in charge, then we can see the first support that has already been tested once at $1759 and if broken again then towards $1750.
Fundamental summary: The Gold and US Dollar pair has been into a volatile trajectory as Moderna company showed that its vaccine is effective against the Delta variant that pushed the dollar higher and stock markets to new height. Lower risk aversion, resurgent dollar and fresh record of US stock markets have been weighing heavily on Gold. However, the Delta variant of the Corona Virus that has put Europe into new travel restrictions has made investors rethink about the recovery trade. Investors are also assessing the timing of interest rate increase and asset purchase tapering. The nonfarm payrolls report will also be out today that will also decide which way Gold is heading.


Wall Street Extends Gains on Positive Economic Indicators and Hopes of an End to Fed's Rate-Tightening Cycle