S&P 500 Drops 5.5% in Four Days Due to SVB Bank Collapse and Inflation Concerns
The S&P 500 has experienced a notable drop from 4,075 points on Tuesday, March 7th, to 3,850 points by Friday, March 11th, representing a decrease of approximately 5.5% in just four days. This significant decline in the index is attributed to various factors, including the collapse of Silicon Valley Bank, rising bond yields, inflation concerns, and fears of a potential interest rate hike. Over the last four weeks, the US500 has declined by 6.60 percent, while over the last 12 months, its price has fallen by 7.40 percent.
On Thursday last week, the Dow Jones saw a significant drop of 345 points, while the S&P 500 and the Nasdaq also experienced losses of 1.4% and 1.7%, respectively. The main focus for investors was the collapse of Silicon Valley Bank, which became the biggest bank failure since 2008, prompting regulators to take control of the Californian bank after its shares sank sharply. The downfall of the tech-focused lender also impacted other banks.
Silicon Valley Bank's share sale to shore up its balance sheet amid losses from bond sales was doomed by a run-on deposit, leading to the bank's collapse. This news overshadowed the latest jobs numbers, which showed that US employers had hired more workers than expected in February. The nonfarm payrolls increased by 311,000, indicating strength in the job market.
However, unemployment unexpectedly rose to 3.6%, and wage inflation cooled, easing some concerns that a still-tight labor market would prompt sharper interest rate hikes. Overall, it was a tough week for the stock market, with the Dow experiencing its worst week since September, down 4.5%, while the S&P 500 and the Nasdaq lost 4.9% and 5.5%, respectively. Investors will be closely watching for any further developments in the financial sector and the job market, which have significant impacts on the economy and the stock market.

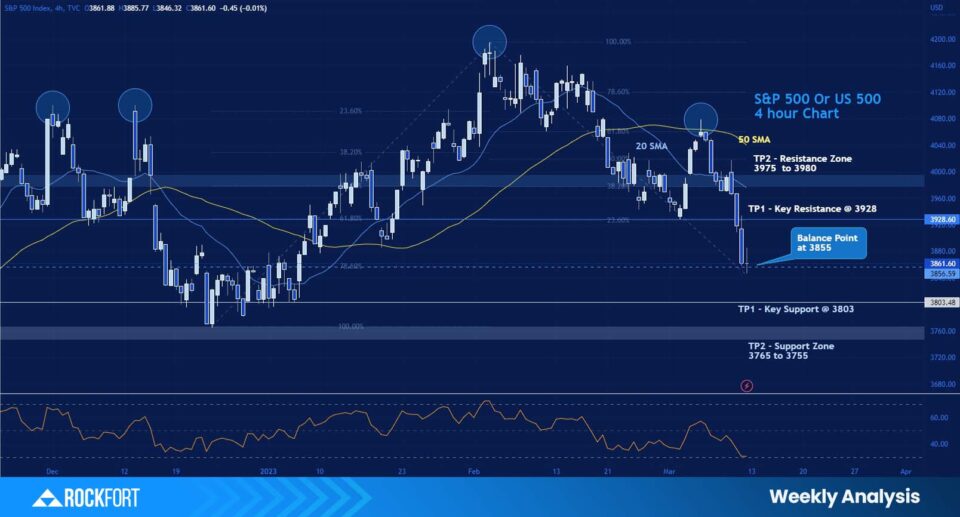
Chart Action Points
| Action: Potential buy positions above $3855 | Action: Potential sell positions below $3855 |
| Take Profit 1 (TP1) at $3928 | Take Profit 1 (TP1) at $3803 |
| Take Profit 2 (TP2) at $3975 | Take Profit 2 (TP2) at $3765 |
Comments
- The RSI Reading on the US 500 4-hour chart is at 30.35 which indicates the index is oversold, and there may be a buying opportunity for traders looking to capitalize on a potential price reversal.
XAU/USD – Gold Prices Rally as Jobs Report Eases Rate Hike Expectations
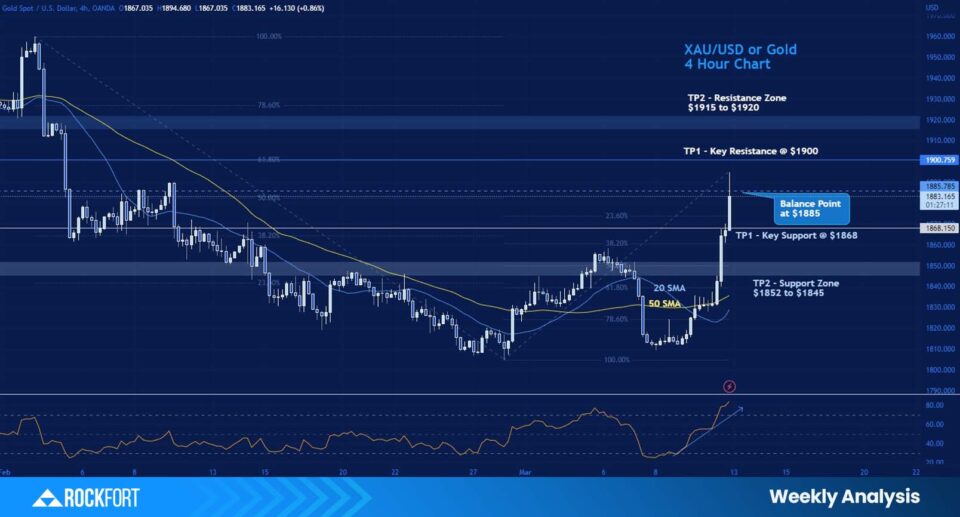
Chart Action Points
| Action: Potential buy positions above $1885 | Action: Potential sell positions below $1885 |
| Take Profit 1 (TP1) at $1900 | Take Profit 1 (TP1) at $1868 |
| Take Profit 2 (TP2) at $1915 | Take Profit 2 (TP2) at $1852 |
Comments
- The RSI (Relative Strength Index) indicator on the 4-hour chart for gold is at 84 points, which is considered overbought territory. An RSI value above 70 typically indicates that an asset is overbought and may be due for a pullback or correction. The high RSI reading for gold suggests that buyers have been pushing the price up aggressively, potentially leading to a price correction in the near future.
- In light of the recent gold price rally, with prices gaining almost 2% to above $1860 an ounce on Friday, March 11th, it is not surprising to see a high RSI reading. The gain in gold prices was attributed to the latest jobs report, which sent the dollar down.
Gold prices rallied on Friday, gaining almost 2% to climb above $1860 per ounce, as the latest jobs report caused the dollar to decline. The US economy added 311,000 jobs in February, which was significantly more than expected, but the unemployment rate increased to 3.6%, and wage growth slowed. These developments have eased expectations of a more aggressive interest rate hike by the Federal Reserve.
The latest jobs report has resulted in traders being evenly divided on whether the Fed will opt for a 25 or 50 basis points increase on March 22nd. This uncertainty has provided a boost to gold prices as the precious metal is viewed as a safe-haven asset during times of market volatility and uncertainty.
Meanwhile, hawkish comments from European Central Bank (ECB) policymakers continue to signal an increase in borrowing costs, which is expected to boost the euro and weigh on the dollar, further supporting gold prices. In Canada, the central bank has already paused its tightening cycle, while the Bank of Japan continues to hold its ultra-easing monetary policy as expected.
The recent rally in gold prices highlights the importance of diversification in a well-rounded investment portfolio. As evidenced by the recent volatility in the stock market, gold can serve as an effective hedge against market downturns and economic uncertainty.
However, it is important to note that gold prices can be influenced by a wide range of factors, including geopolitical tensions, inflation expectations, and changes in interest rates. Investors should carefully consider their investment objectives and risk tolerance before making any decisions related to gold or other precious metals.


Wall Street Extends Gains on Positive Economic Indicators and Hopes of an End to Fed's Rate-Tightening Cycle