As a forex trader, it is essential to understand the various technical indicators that can be utilized to enhance your trading strategy. Channel indicators are a type of trading indicator commonly used in technical analysis. They form a band around the price chart and can help traders identify trends, momentum, and volatility.
However, it is important to note that not all channel indicators should be treated equally, and their effectiveness may vary depending on the context in which they are used. In this article, we will explore the fundamentals of channel indicators and provide insights into how forex traders can effectively use them to enhance their trading strategies. Whether you're new to trading or a seasoned pro, understanding how to use indicators effectively can be the key to unlocking profitable trades. So let's dive in and explore how you can effectively incorporate channel indicators into your trading strategy.
What is a channel indicator in technical analysis?
A channel indicator usually comprises two or sometimes three sets of lines plotted on the price chart. In many cases, the upper line is plotted above the high of a price. The lower channel line is plotted below the low of the prize. And depending on one’s reference, the channel indicator can also comprise amid align also known as the mid-band.
These three lines combined, form a channel or a band around the price. Depending on the type of channel indicators that you are using, they can visually interpret price trends, volatility or momentum.
The first picture below represents a channel indicator formed by using the moving averages.
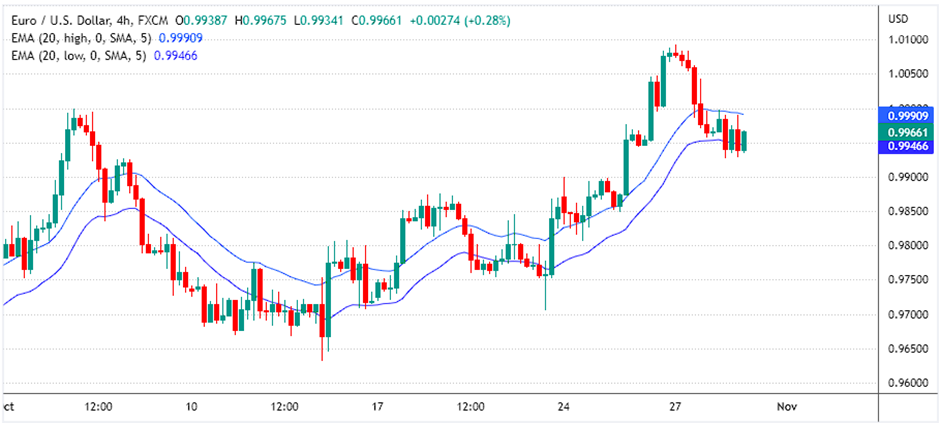
The chart above shows the use of a 20-period exponential moving average to create a moving average channel band that takes into account both high and low prices, in addition to the typical closing price. This approach can provide a clearer understanding of price trends for traders. Strong trends are usually identified when prices break above the upper channel line or below the lower channel line.
The moving average channel indicator is just one method for interpreting channel indicators. Its main difference compared to other methods is that it uses the slope of the bands, rather than simply moving average crossovers, to indicate trend strength. Strong breakouts in the price can confirm the strength of the trend.
In this way, the moving average channel indicator is a useful tool for gaining a deeper understanding of how to channel indicators work and how they can be incorporated into trading strategies. By utilizing these channel bands, traders can potentially identify profitable trading opportunities and make more informed trading decisions.
What are the different types of channel indicators?
Some of the most popular channel indicators, to name a few are as below:
- Bollinger bands
- Donchian channels
- Keltner channels
The above three channel indicators are used in technical analysis An indicator based. Meaning that you can simply activate these indicators and use them on the price chart. Besides the above three channel indicators that we mentioned, there are also channel lines that are commonly used. These include:
- Equidistant channel
- Regression channel
- Fibonacci channel
The main difference between the first set of channel indicators to the second is that with the channel lines, traders have to plot them on the chart by picking a starting and ending point. Because of this, using the second set of channel indicators requires a bit of subjectivity.
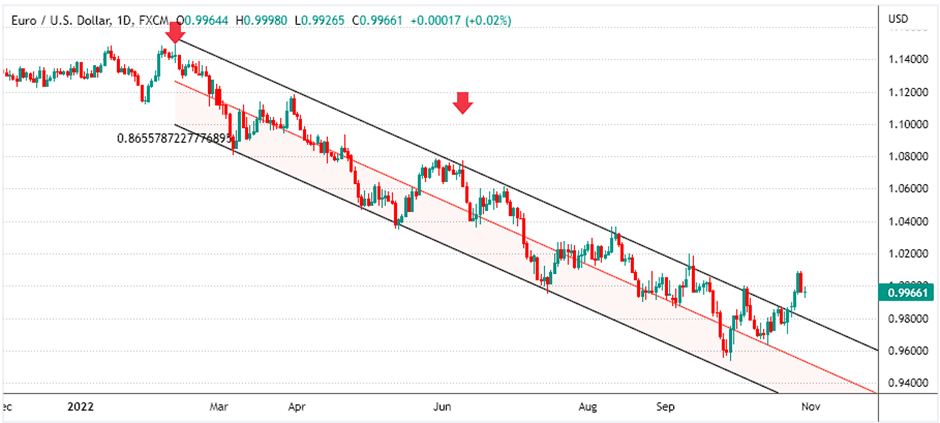
The chart above shows a linear regression channel line indicator plotted on the EURUSD daily time frame chart.
Linear Regression Channel line example
We marked two points with downward arrows to form the linear regression line. Once plotted, this line extends forward and shows how price has been adhering to this downward trend. The price action from July onwards clearly illustrates this, with a recent breakout from the linear regression line. However, subjectivity plays a significant role in plotting the linear regression line. Depending on the selected points, the line can differ greatly, leading to instances where price may not conform to the line and see a breakout sooner. This is unlike channel indicators, which involve no subjectivity, requiring only activation to plot lines on the chart.
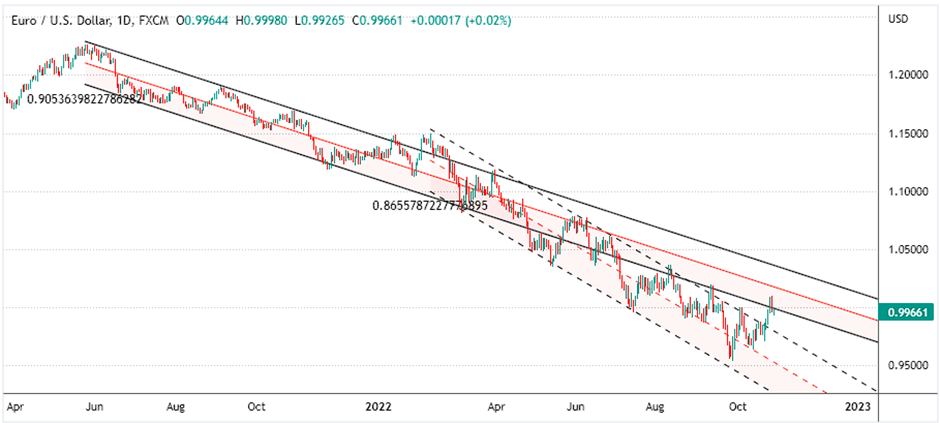
The above chart shows the practicalities of using the linear regression channel line for example. Here, you will notice that we now have two linear regression channel lines. The longer one which starts from around June shows prices deviating from this channel.
Consequently, a new channel line had to be plotted in order to capture the price movements on stop as you can see from the above, although channel lines are quite intuitive traders may need to tweak this indicator when the trend shifts. This is something that can be avoided when using channel indicators.
Other ways of using channel line indicators
We can explore other channel line indicators in addition to the linear regression channel line. These indicators are available under the channels category in the indicators menu on the MT4 trading platform.
The linear regression channel line indicator has the ability to potentially project future price action, although this does not guarantee that the price will respect the line.
Traders use other channels such as the equidistant channel line to prepare for possible breakouts from the trend. Breakouts could indicate a shift in trend or a temporary short-term correction.
The success of using channel line indicators like the equidistant channel line depends on traders' ability to read the price action and understand what is happening.
Using channel line indicators alone does not guarantee a price change. Traders must also consider fundamental factors responsible for the shift in momentum.
In general, channel line indicators are useful in identifying potential breakouts. Traders can use complementary technical indicators to confirm the breakout and trade in the direction of the trend.
It is important to note that traders may need to constantly readjust the channels to capture the trend and the width of the price action movement within the channel.
Differences between channel indicators and channel lines
To better understand how channel bands work, it is important to recognize the differences between them. This knowledge can help traders better understand the application of these technical indicators and how they relate to price action.
Both channel bands and channel lines indicate the trend direction, regardless of which one is used. A downward sloping channel band indicates a downtrend, while an upward sloping channel line shows an uptrend. However, the way in which these indicators are constructed can differ greatly.
For instance, the Bollinger bands indicator, one of the most popular trend and band indicators, is built based on volatility. As a result, the Bollinger band construction can greatly differ from using any other channel indicator.
The channel bands depict both the trend and the volatility, with volatility measured by the distance between the upper and lower bands. The only notable difference between channel line indicators and channel lines themselves is the subjective aspect. While channel indicators can be easily plotted, channel lines may produce different patterns or results among different traders.
For novice traders, it is recommended to start with using the channel bands indicator before moving on to the channel lines indicator once they have gained sufficient experience. Due to the subjectivity involved in using channel lines, it takes time and practice to accurately identify starting and ending points for them.
Combining channel bands and channel lines
One question that may come to mind is whether you can use the channel line alongside the channel bands indicator.
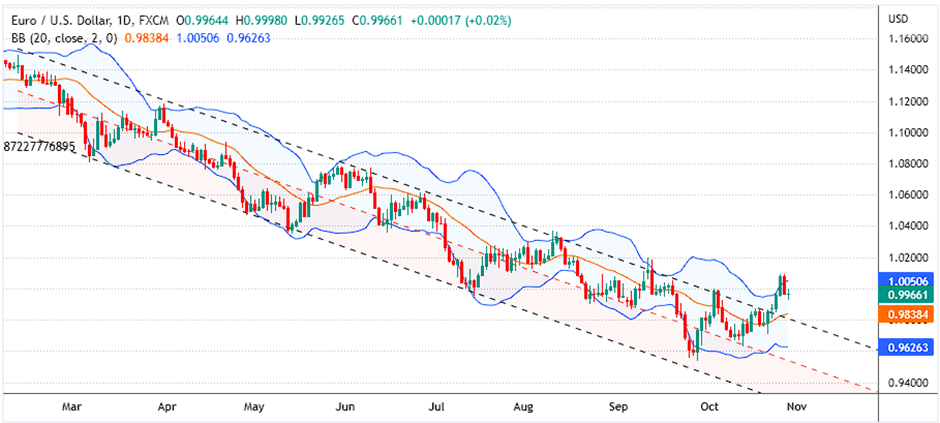
The chart above shows how combining the Bollinger Band indicator with the linear regression channel line can provide useful insights for traders. While the initial combination may not appear informative, closer analysis reveals interesting trends in price action.
For example, the expansion and contraction of the Bollinger band can indicate rising and falling volatility, which often occurs when prices hit the upper or lower end of the linear regression channel line. By considering both indicators together, traders can gain a better understanding of the trend and potential turning points.
It's important to note that the linear regression channel line includes extended lines, which can help predict the most likely path of price action if the trend continues. Traders can use the Bollinger bands to identify turning points in price, and can further enrich their chart setup by adding an oscillator to confirm these points.
Ultimately, the effectiveness of these indicators in forex trading depends on the trader's ability to interpret and utilize them. However, combining channel lines and bands can reveal valuable information about price trends and potential trading opportunities.
Are channel lines and indicators a good way to trade forex?
Traders may wonder whether channel lines or channel indicators are effective for trading forex. Like any technical indicator, the effectiveness of channel lines or channel bands depends on a trader's understanding of the tool and its application in a trading strategy.
Both channel lines and channel bands can be used, depending on a trader's familiarity with each indicator. Channel lines are often used for price action-based trading setups, while channel bands simply plot the bands on the price chart.
During strong uptrends or downtrends, channel lines can be useful for identifying key pivot points and swing points in price. However, it's important to note that trends may not always be sustained for prolonged periods of time, and price action can change course unexpectedly. Experience in trading and analyzing forex markets can play a role in determining success or failure with these tools.
From a chart setup perspective, channel lines and bands don't clutter the chart, as they form above or below the price high and low. This allows traders to maintain a clean chart interface while still being able to interpret price action and additional information conveyed by these indicators. Overall, channel lines and bands can be effective tools for forex traders, but it's important to understand their nuances and apply them correctly in a trading strategy.

