Fibonacci Trading
You may have heard about Fibonacci trading, which is a rather popular trading method these days. It relies on Fibonacci retracements, which is a method that allows modern-day traders to calculate the future price supports and resistances of assets. As such, it allows traders to predict how the price might behave, how far up it might grow, or how low it will drop before it is stopped.
The method has proven its efficiency time and time again, and a lot of traders tend to rely on it before deciding upon their next move. Today, we will talk about what it is, how it works, and how can we use it for making educated trading decisions that will help you perform better in volatile markets.
Where does Fibonacci retracements' name come from?
Let's start with the basics, and talk about the name Fibonacci. It comes from a mathematician who lived around 850 years ago, Leonardo Fibonacci. As part of his work, Fibonacci developed a sequence of numbers known as the Fibonacci sequence, as well as the well-known golden ratio.
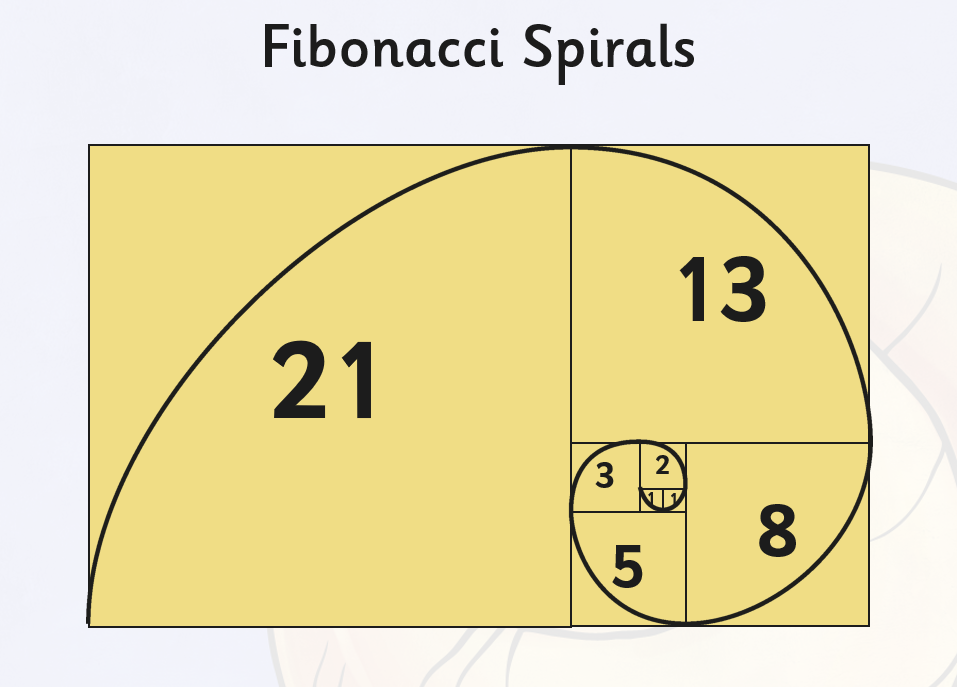
The Fibonacci sequence is also rather well-known today, and it is basically a series of numbers where every number is a sum of the two numbers that come before it. So, if you start at 1, the next in the line is also 1, because the sum of 1 and the number before it (0) is 1. The sum of 1 and 1 is 2, while the sum of 2 and 1 is 3, and so on. In the end, the sequence looks something like this: 1, 1, 2, 3, 5, 8, 13, 21, 34, and so on.
The sequence is based on the reproduction rate of two theoretical rabbits, and the calculation regarding the subsequent population growth provided that the reproduction of the following generations continues.
As for Fibonacci's golden ratio, it also plays a big role, and it focuses on the ratio between the numbers in the sequence. In fact, many would call it the most important part of Fibonacci's work. You see, regardless of which number in the sequence you chose if you divide it by the number that came before it, you will always get the same result — 1.618. This has a fancy name, the golden ratio, and it exists everywhere in nature. It is a universal mathematical truth that serves as the building block of the world, and anything else in existence.
There are countless examples where the pattern fits perfectly, such as sunflowers, galaxies, animals, and even humans. For example, the golden ratio applies when calculating the length of a human forearm to the hand. It always fits perfectly, and the result is always 1.618.
Why is this important?
At this point, you might be wondering how all of this fits together with modern-day trading and is the logic of the 12th-century mathematician really useful in today's markets? The answer is — it is.
According to Fibonacci followers, if the same pattern is found everywhere in nature, the universe, and even our own bodies. The same surely applies to the markets. It seems that the pattern is just the natural way of the world. And if it can be found in something, this means that it is possible to make accurate predictions about it.
The most common way that the pattern is used in modern-day markets is through Fibonacci retracements.
So, if the market saw a positive performance, and it doesn't move in a straight line, it will, eventually, start its drop back down. This is all a part of its natural progression, and traders believe that the Fibonacci ratio can help them predict how far will the market drop.
How exactly is this used in trading?
In trading, the mentioned number of the golden ratio — 1.618 — is translated into three different percentages — 23.6%, 38.2%, and 61.8%. While some traders also include other levels, such as 50% and 76.4%, the mentioned three levels are the most popular and most commonly used.
50% is not even a part of the Fibonacci numbers, but it is generally popular as well.
The percentages that are most commonly applied to charts include 38.2%, 50%, and 61.8%, which is why we will focus on these.
When you apply them to the chart, you can calculate hidden resistance and support levels that the market seems to respect for some reason.
So, how does it actually work? Simple. When the market rises and reaches its peak, it will often drop back down to one of these three levels of its rise. The first one, of course, is a drop of 38.2% of the rise it experienced. This is the first level of the Fibonacci retracement, which is named due to the fact that the price is retracing its growth to this percent.
If the drop is strong, it is common for this level to get broken. If that's the case, traders expect the price to drop to the second most popular level, which is 50% of the growth. If this level gets broken as well, the retracement is expected to continue until it reaches 61,8%.
Of course, it can also happen that this level gets broken, as well. If that happens, those who trust in this method of calculating the price move expect that the price will simply return to the level where it started its growth, and nullify the surge completely.
So, if you know where the price was when the growth started, and you know its peak — it is pretty easy to calculate the distance between these two points, and mark the expected retracement levels between them.
It works the other way around, too
Of course, this does not only apply to falling markets. Traders also use the same levels to predict the price movement whenever there is a new rally.
To measure this, traders look at past performance and use the most recent major drop. When the price rallies, traders expect it to stop its growth at 38.2% of the amount it lost during the last drop. If the price goes beyond this, they will expect it to hit 50% of the price it lost, and stop there.
If this level is breached, they will then expect it to cut the growth short when it approaches 61.8% of the drop. And, of course, if this level gets broken as well, traders will expect the price to go all the way up to the level where it was when the drop started. From there, anything can happen — the price might start dropping again, or it might surge further up. This becomes an uncharted territory that is more difficult to predict.
In other words, the Fibonacci ratio works if you know the boundaries of the price movement.
Is Fibonacci trading reliable?
While the Fibonacci retracement works often enough to be recognized as one of the methods of calculating the price movement, it definitely won't work 100% of the time. Otherwise, the price would simply always remain within two levels, and it would never go beyond them, which is clearly not the case.
As such, there are those who believe in it and those who are not among its biggest fans. Many believe that the price respects the Fibonacci levels just because traders believe in them. Basically, when the falling price approaches the first level, it stops there because enough traders believed it will do so, and they entered positions in a way that turned the market sentiment around and impacted the price as a result.
As such, this ends up being a self-fulfilling prophecy, meaning that the price wouldn't have stopped if people didn't believe it will stop. In other words, the price doesn't respect Fibonacci percentages due to them being 'magical numbers,' but because the market sentiment gets strong enough when these percentages are approached.
In the end, whether you are a believer in the Fibonacci numbers or a skeptic, knowing these levels and how they might impact the price is useful, as you will gain additional insight, and know what to expect. This is why everyone uses these calculations, even if they don't really believe in them. They know that there are many who do, which means that these levels should be kept a close eye on.
It is all subjective, and the skeptics usually include traders who lost money while trying out this method, which made it unreliable in their eyes. Of course, some doubt this strategy because it is not grounded in any logical proof, other than the belief that these are the numbers that drive the universe.
In other words, it is very subjective, and it is more than likely that your experience with these levels will determine whether or not you will trust them in the future. The method is not inherently unreliable, but it is hard for people to trust it if they do not see the results or any logic behind trusting them in the first place.