XAUUSD recovering before the FOMC Meet today.

Here are today’s directional views from our market research desk! These can be starting points for your own research to identify opportunities that suit your trading charts and trading style. Like what you see? Feel free to forward this to a friend!

Please note that the analysis presented in the charts below should not be considered investment or trading advice. They are for educational purposes only and you should consider seeking advice from an independent financial advisor.

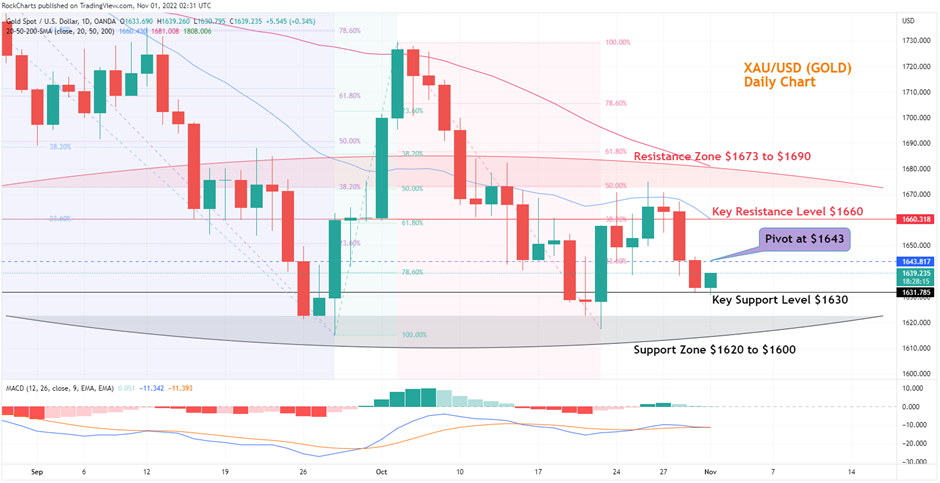
XAUUSD Chart Analysis

After dropping from the key resistance level of $1660 the gold lost ground further and dropped to the key support level at $1630. Since today morning the gold has been on a recovery path as the USD is dropping against all the major pairs.  With the start of the Asian session, investors scrambled to buy apparently cheaper gold. The price action would likely stay on the same path till we know what FOMC has to offer on the interest rate front later today. If interest rates are raised by another 75bps today, then Gold could drop sharply tonight to move below the support zone on the chart at $1620.

XAUUSD Daily Chart
XAUUSD Daily Chart

XAUUSD Chart Direction Bias – 1 Week

Trade Insights – XAUUSD

The chart shows possible short positions if Gold drops below the $1630 mark with the first target of the key support level at 1620 and then the test for $1600.

Alternatively, Chart shows viable long positions above the key support level at $1630 to first test the pivot at $1643 and after consolidation above this level then the test of the key resistance level at $1660.

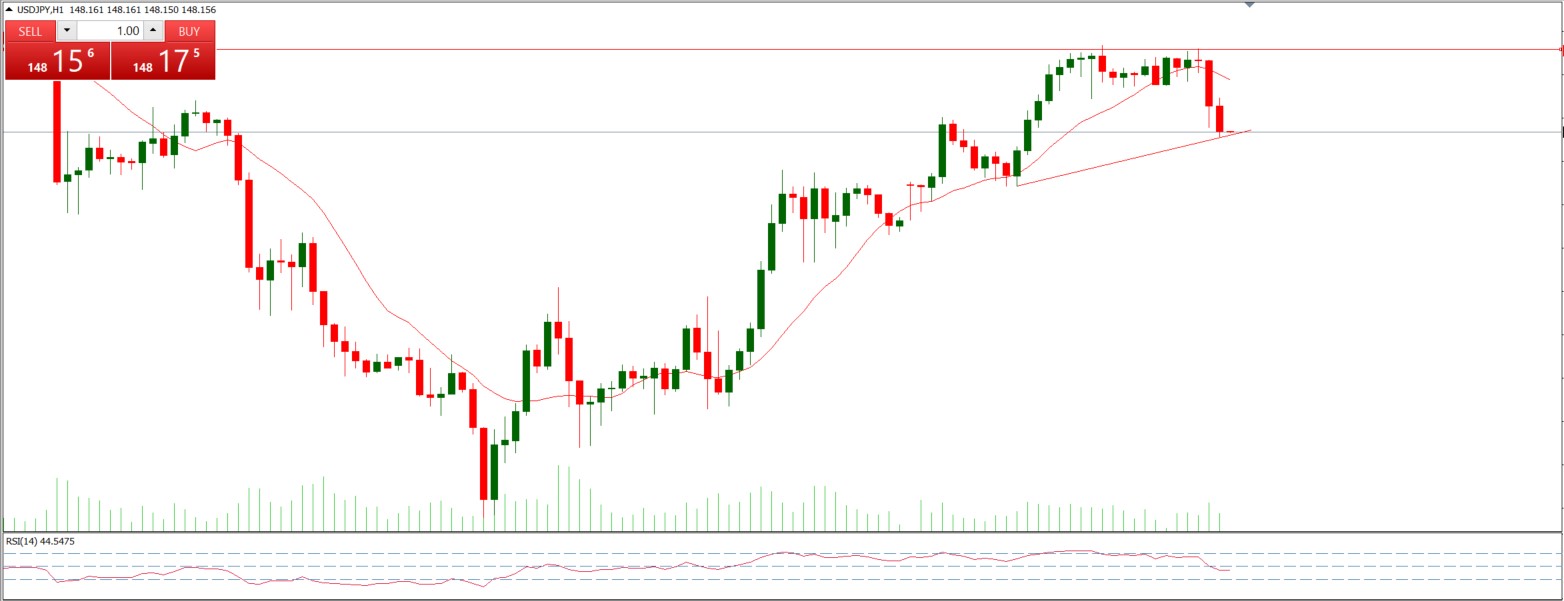
Mover and Shaker of the day - USD/JPY

USD/JPY dropped by 0.35% or 0.5240 in the early trading today in anticipation of a softer approach on the interest rate front by the Feds in the FOMC in the meeting later today.

USDJPY Chart – Market mover of the day

It is important to understand that the analysis is intended for educational purposes only. Traders are encouraged to use their own judgment and analysis when making trading decisions.


1. Identify the Balance Point on the chart – The Balance Point is a level on the chart that represents an equilibrium point between supply and demand. It can serve as a potential entry point for a trade. It’s important for the trader to determine whether the current price is above or below the Balance Point before making any trading decisions.

2.
Wait for the price to approach potential profit levels – After entering a trade, it may be helpful to wait for the price to approach potential profit levels on the chart. These levels can be identified as areas where price reversals have occurred in the past. When the price approaches a potential profit level, it may be time to consider initiating further trades to test the next level of take profit limits.

3. Monitor the trade as the price hovers around the Balance Point – While the price is hovering around the Balance Point, it’s important to monitor the trade and make adjustments as necessary to ensure that it is still in line with market conditions. If market conditions change, it may be best to exit the trade.

4. Determine the market direction – Once a clear market direction has been established, the trader can set the trade with stop loss and take profit limits as they appear on the chart. It may also be helpful to consider using trailing stops to lock in profits and minimize potential losses. To determine the market direction, the trader may use technical analysis and other market indicators.

5. It’s important to remember that technical indicators, including the RSI, are not foolproof and can sometimes provide false signals. Therefore, it’s important to exercise caution when making trading decisions based solely on technical indicators. To make informed trading decisions, it’s recommended to use technical indicators in conjunction with other indicators and analysis

Disclaimer: The information provided does not constitute, in any way, a solicitation or inducement to buy or sell securities and similar products. Comments and analysis reflect the views of RockGlobal at any given time and are subject to change at any time. Moreover, they cannot constitute a commitment or guarantee on the part of RockGlobal. The recipient acknowledges and agrees that by their very nature any investment in a financial instrument is of a random nature and therefore any such investment constitutes a risky investment for which the recipient is solely responsible. It is specified that the past performance of a financial product does not prejudge in any way their future performance. The foreign exchange market and financial derivatives such as futures, CFDs (Contracts for Difference), warrants, turbos or certificates involve a high degree of risk. They require a good level of financial knowledge and experience. RockGlobal recommends the consultation of a financial professional who would have a perfect knowledge of the financial and patrimonial situation of the recipient of this message and would be able to verify that the financial products mentioned are adapted to the said situation and the financial objectives pursued. RockGlobal recommends reading the “Product Disclosure Statement” section of website for any financial product mentioned.

Any questions? You can call us on 09 281 2012 or email us at info@rockfortmarkets.com any time to help you with your trading requirements.