Chart Analysis
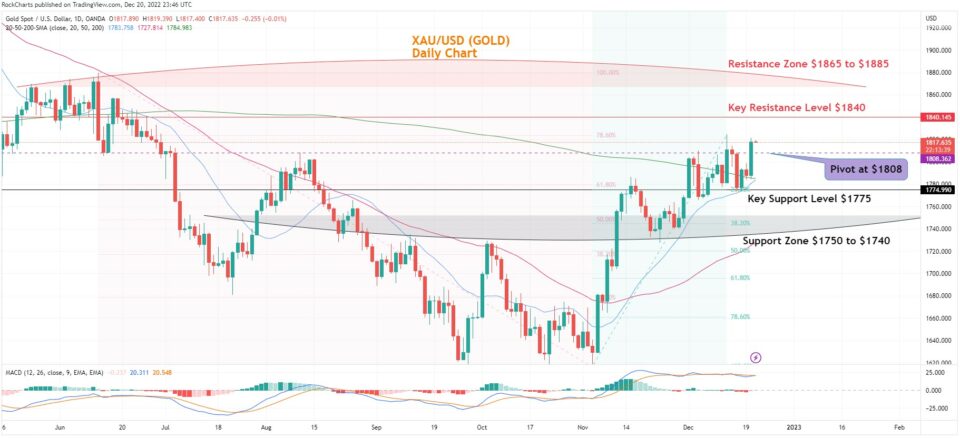
Gold jumped up to $1821 after the US dollar was sold off due to the surprise move from the Bank of Japan to increase the yield curve control targets. However, as the US Bond yields pushed higher on the news the Gold was pressured down a bit. It seems that the ongoing consolidation above the support level at $1775 is over and Gold can witness an upward breakthrough from here.
The 20-day SMA is rising to provide support to gold prices from the bottom. The 200-day SMA is about to cross with the 20-day SMA line on the chart and this would mean a jump in the gold prices to first test the Key Resistance level at $1840 and then further touch the $1850 resistance zone. This could follow with a retracement of gold prices below the cross-level around $1785 towards the first week of January 2023.
The MACD indicator line is still trading in the overbought zone trying to move above the signal line. As soon as the blue indicator line moves below the orange signal line and starts to part away would signal a Sell off on Gold.
Daily Chart Directional bias - 1 Week
- Resistance Zone: $1865 to $1885
- Key Resistance Level: $1840
- Major Pivot Point: $1808
- Key Support Level: $1775
- Support Zone: $1750 to $1740
- 200 Day SMA – Green Line
- 50 Day SMA – Red Line
- 20 Day SMA – Blue Line
Chart Trading Insights
Trade Insights – XAU/USD
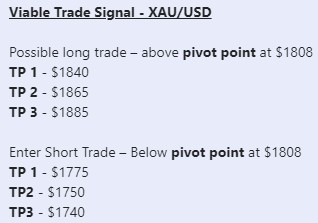
The chart shows viable long positions above the major pivot point at $1808 heading towards the first target of the key resistance level at $1840 and then the test of the key resistance zone between $1865 to $1885.
Alternatively, possible short positions below the major pivot point at $1808 with the target of the key support level at $1775 then the test of the support zone between $1750 to $1740.

