Chart Analysis
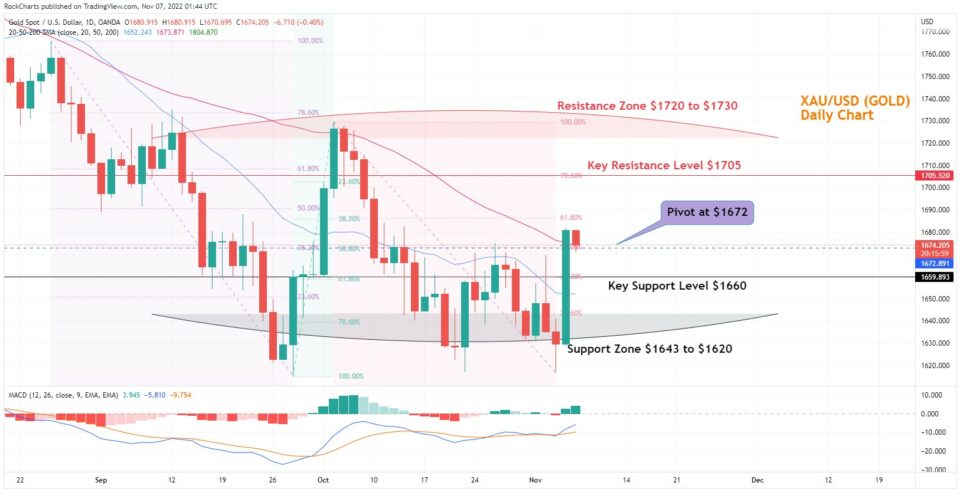
The XAU/USD charts show that the pair jumped up sharply by 3% on Friday after the better-than-expected NFP data print. The investors are now focusing on October CPI data due to be released this week Thursday. The above gold chart shows that the pair is trading just above the Pivot on the Chart at $1672 and has retrieved a bit as traders are registering profits from the upside breakthrough. Gold could continue to rise till Thursday as the market awaits the CPI data now.
Please check the Chart Trading Insights below -
- Resistance Zone: $1720 to $1730
- Key Resistance Level: $1705
- Major Pivot Point: $1672
- Key Support Level: $1660
- Support Zone: $1643 to $1620
- 200-Day SMA – Green Line
- 50-Day SMA – Red Line
- 20-Day SMA – Blue Line
Daily Chart Directional bias - 1 Week
Trade Insights – XAU/USD
The chart shows viable long positions above the major pivot point at $1672 heading toward the first target of resistance at $1686 and then test of the key resistance level at $1705. Then further test of the resistance zone between $1720 to $1730.
The possible entry of long above below the major pivot at $1672.
Potential first-take profit could be at – $1705
Potential second-take profit could be at – $1720 to $1730.
Alternatively, possible short positions below the major pivot point at $1672 with the target to test the key support level at $1660 then the test of the support zone between $1643 to $1620.
Possible entry for short trades below the major pivot point at $1672.
Potential first take profit could be at – $1660
Potential second take profit could be at – $1643
Potential third take profit could be at – $1620.
