XAU/USD – Gold facing Resistance - needs a major push to break through the confluence zone.

Here are today’s directional views from our market research desk! These can be starting points for your own research to identify opportunities that suit your trading charts and trading style. Like what you see? Feel free to forward this to a friend!

Please note that the analysis presented in the charts below should not be considered investment or trading advice. They are for educational purposes only and you should consider seeking advice from an independent financial advisor.

Chart of the Week – 26th August 2022

  • Gold - XAU/USD – Gold facing Resistance - needs a major push to break through the confluence zone.
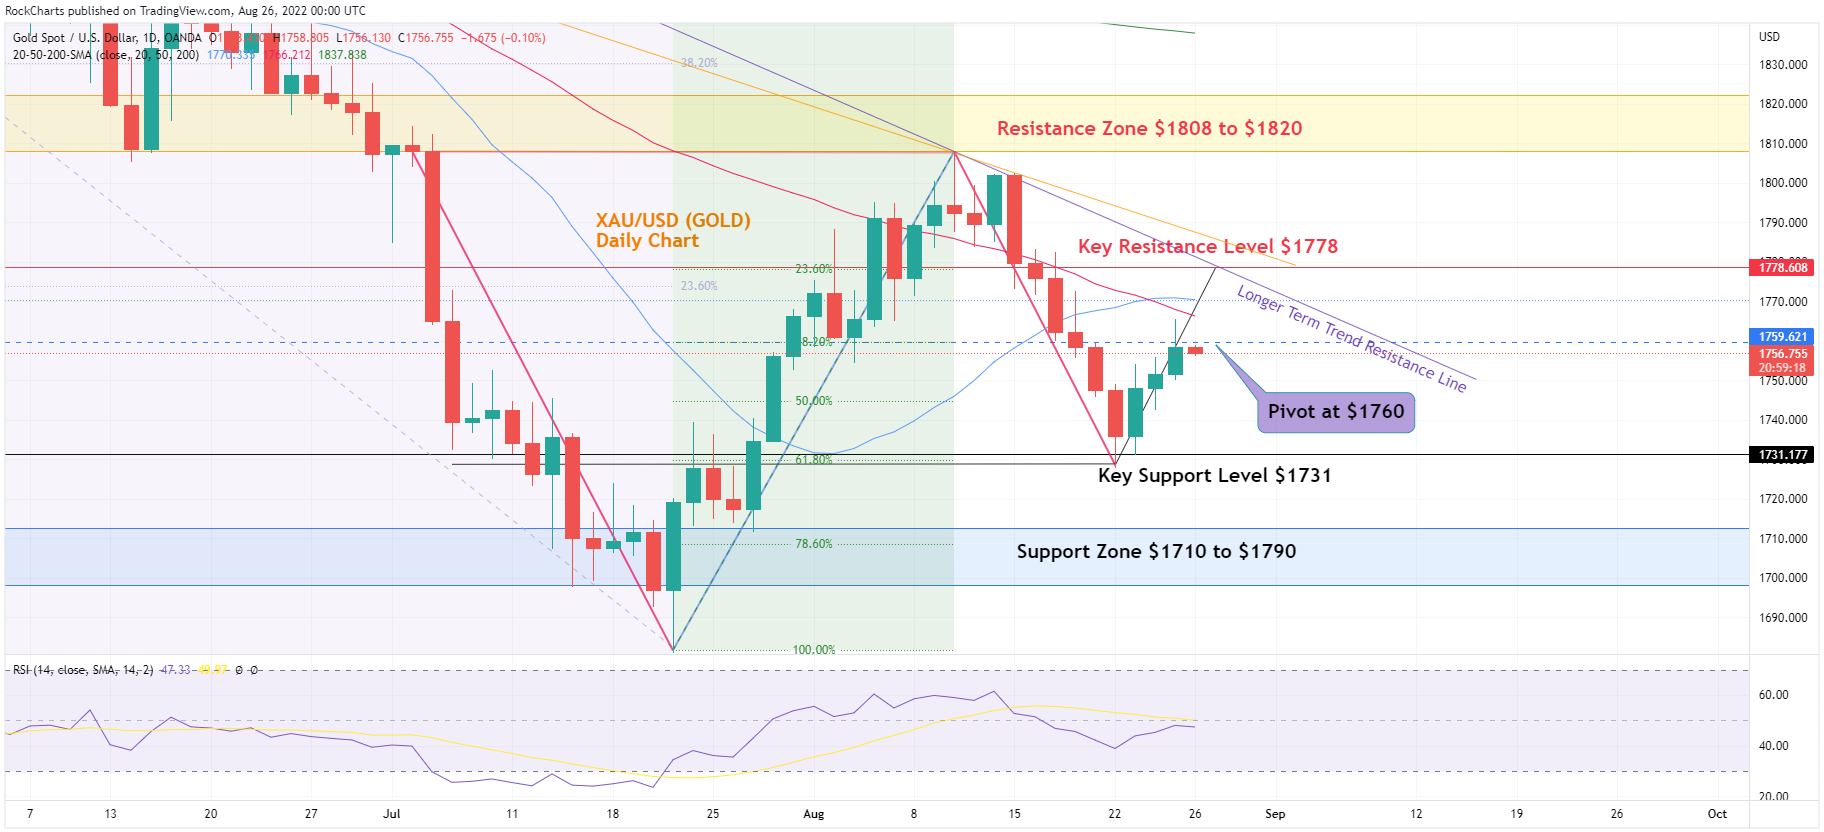
XAU/USD daily chart
XAU/USD daily chart

Chart Analysis

Gold Chart shows after hitting the $1765 previous Pivot point met with resistance and the price is moving down now. The rejection could be temporary or could turn out to be a more substantial resistance for Gold due to several resistance indicators meeting just above the current level. The resistance cluster above is comprised of Confluence points of Fibonacci 38.20%, new Pivot now at $1760 that has moved down from $1765. So apparently, gold needs to break through the confluence zone just above the current prices, including the key resistance level at $1778 the longer-term trend Resistance Line, Fib levels and the SMA lines. At this stage all indicators are indicating at Headwinds Gold would face in the next week.    

  • Resistance Zone: $1808 to $1820
  • Key Resistance Level: $1778
  • Major Pivot Point: $1760
  • Key Support Level: $1731
  • Support Zone: $1710 to $1790
  • 200 Day SMA – Green Line
  • 50 Day SMA – Red Line
  • 20 Day SMA – Blue Line

Daily Chart Directional bias - 2 Weeks 

Trade Insights – XAUUSD

The chart shows viable Short Positions under the Pivot point of $1760 or current gold prices. Short positions towards the first target of $1745 Support and, then further test of Key Support Level at $1731.

Possible entry of Short Trades below the Pivot at $1765 or the current level

Potential first take profit could be at - $1745  

Potential second take profit could be at - $1731

Potential Third take profit could be at $1710

Alternatively, possible Long positions if Gold bounces back up above the $1760 Pivot Point and to first test the resistance at $1770 and then the test of the resistance level at $1778.

Possible Entry for Long trades above the Pivot at $1760.

Potential first take profit could be at - $1770 Resistance

Potential second take profit could be at - $1778 Resistance

Potential third take profit could be at - $1808 Resistance Zone.

It is important to understand that the analysis is intended for educational purposes only. Traders are encouraged to use their own judgment and analysis when making trading decisions.


1. Identify the Balance Point on the chart – The Balance Point is a level on the chart that represents an equilibrium point between supply and demand. It can serve as a potential entry point for a trade. It’s important for the trader to determine whether the current price is above or below the Balance Point before making any trading decisions.

2.
Wait for the price to approach potential profit levels – After entering a trade, it may be helpful to wait for the price to approach potential profit levels on the chart. These levels can be identified as areas where price reversals have occurred in the past. When the price approaches a potential profit level, it may be time to consider initiating further trades to test the next level of take profit limits.

3. Monitor the trade as the price hovers around the Balance Point – While the price is hovering around the Balance Point, it’s important to monitor the trade and make adjustments as necessary to ensure that it is still in line with market conditions. If market conditions change, it may be best to exit the trade.

4. Determine the market direction – Once a clear market direction has been established, the trader can set the trade with stop loss and take profit limits as they appear on the chart. It may also be helpful to consider using trailing stops to lock in profits and minimize potential losses. To determine the market direction, the trader may use technical analysis and other market indicators.

5. It’s important to remember that technical indicators, including the RSI, are not foolproof and can sometimes provide false signals. Therefore, it’s important to exercise caution when making trading decisions based solely on technical indicators. To make informed trading decisions, it’s recommended to use technical indicators in conjunction with other indicators and analysis

Disclaimer: The information provided does not constitute, in any way, a solicitation or inducement to buy or sell securities and similar products. Comments and analysis reflect the views of RockGlobal at any given time and are subject to change at any time. Moreover, they cannot constitute a commitment or guarantee on the part of RockGlobal. The recipient acknowledges and agrees that by their very nature any investment in a financial instrument is of a random nature and therefore any such investment constitutes a risky investment for which the recipient is solely responsible. It is specified that the past performance of a financial product does not prejudge in any way their future performance. The foreign exchange market and financial derivatives such as futures, CFDs (Contracts for Difference), warrants, turbos or certificates involve a high degree of risk. They require a good level of financial knowledge and experience. RockGlobal recommends the consultation of a financial professional who would have a perfect knowledge of the financial and patrimonial situation of the recipient of this message and would be able to verify that the financial products mentioned are adapted to the said situation and the financial objectives pursued. RockGlobal recommends reading the “Product Disclosure Statement” section of website for any financial product mentioned.

Any questions? You can call us on 09 281 2012 or email us at info@rockfortmarkets.com any time to help you with your trading requirements.