Chart Analysis
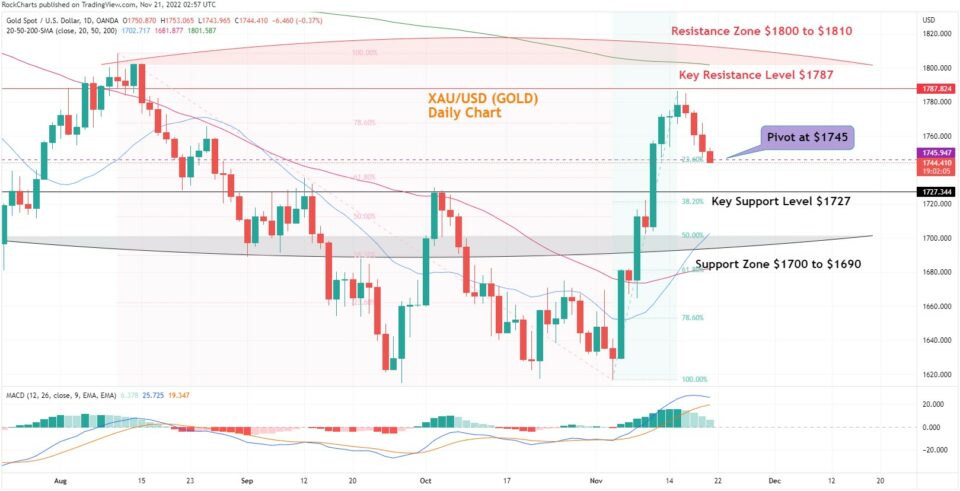
The gold chart shows that the pair has dropped from the previous Major Pivot at $1767 and is not trading just under the current Major Pivot at $1745 and the 23.60 Fibonacci level. The next support is around $1736 and there is the Key Support Level at $1727. After the 20-day SMA crossed over the 50-day SMA that confirmed the overbought zone for gold to investors and this prompted them to start selling out of Gold. The sell-off has been slow as buyers have been holding the sell-off quite well. The MACD signals are also now taking a downward turn from the overbought zone and could cross below the signal orange line.
Please check the Chart Trading Insights below
- Resistance Zone: $1800 to $1810
- Key Resistance Level: $1787
- Major Pivot Point: $1745
- Key Support Level: $1727
- Support Zone: $1700 to $1690
- 200 Day SMA – Green Line
- 50 Day SMA – Red Line
- 20 Day SMA – Blue Line
Daily Chart Directional bias - 1 Week
Trade Insights – XAU/USD
The chart shows viable long positions above the major pivot point at $1745 heading towards the first target of the key resistance level at $1787 and then testing of key resistance zone between $1800 to $1810.
The possible entry of long above below the major pivot at $1745.
Potential first-take profit could be at – $1787
Potential second take profit could be at – $1800 to 1810.
Alternatively, possible short positions below the major pivot point at $1745 with the target to test the key support level at $1727 and then the test of the support zone between $1700 to $1690.
Possible entry for short trades below the major pivot point at $1745.
Potential first-take profit could be at – $1772
Potential second-take profit could be at – $1700
Potential third-take profit could be at – $1690.
