Chart of the Week – 6th September 2022
- Gold - XAU/USD – Consolidating above the key support, Seasonality in gold Weighing on the prices.
Chart Analysis:
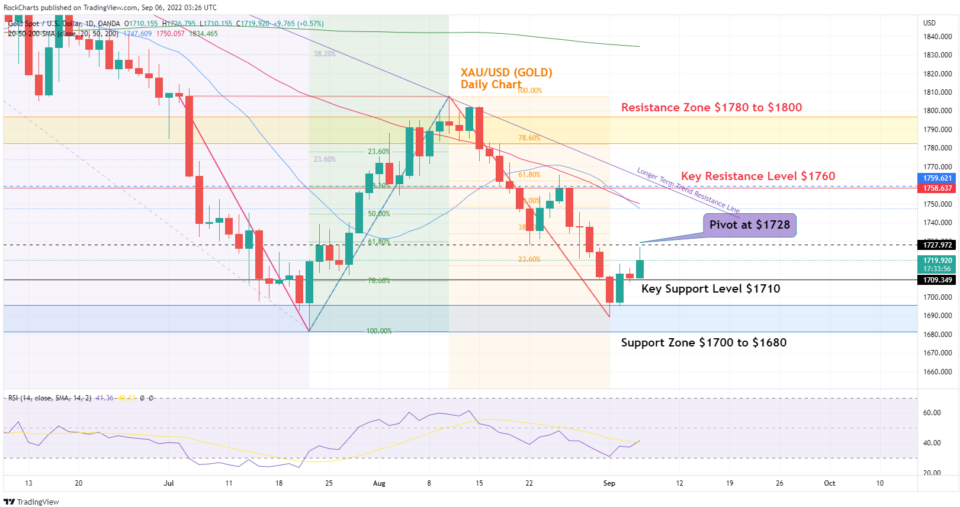
Based on the data gold has experienced a very bearish September month over the past 5 years and faced an average loss of -2.89% during this month. If seasonality must be taken into consideration, then August was also a very bearish month for Gold, and we could see some drop in Gold prices this month too. The chart shows that prices are probably consolidating above the Key Support Level at $1710. After finding resistance at under $1728 Major Pivot Point on the chart, gold has retrieved back sharply today and now sitting at soft support at 23.60% Fibonacci around $1717. Seems gold has already been through the reversal that appears to be a fake-out and Gold could enter a Selloff from under the Key support level. The cross of 20 Day SMA Blue line and 50 Day SMA red line is happening again just after crossing on the 24th of August. The Cross this time on could mean that gold can drop back towards the support and then jump back to test new resistances on the chart.
Please check the Chart Trading Insights below -
- Resistance Zone: $1780 to $1800
- Key Resistance Level: $1760
- Major Pivot Point: $1728
- Key Support Level: $1710
- Support Zone: $1700 to $1680
- 200 Day SMA – Green Line
- 50 Day SMA – Red Line
- 20 Day SMA – Blue Line
Daily Chart Directional bias - 2 Weeks
Trade Insights – XAUUSD – Chart shows viable Short Positions under the Pivot point $1728. Possible short positions towards the first target of $1710 Key Support and, then further test of Key Support Level at $1700 to 1680.
Possible entry of Short Trades below the Pivot at $1728 or current level
Potential First take profit could be at - $1710
Potential Second take profit could be at - $1700
Potential Third take profit could be at $1680
Alternatively, possible Long positions if Gold bounces back up above the $1728 Pivot Point and to first test the resistance at $1760 and then the test of the resistance Zone between $1780 to $1800.
Possible Entry for Long trades above the Pivot at $1728.
Potential First take profit could be at - $1760 Resistance
Potential Second take profit could be at - $1780 Resistance
Potential Third take profit could be at - $1800 Resistance Zone.

