Chart of the Week – XAU/USD – After 4 weeks of consecutive gains, Gold at Downtrend Resistance, Signals of sell positions?
- Resistance Zone: $1865 to $1885
- Key Resistance: $1830
- Major Pivot Point: $1800
- Key Support Level: $1755
- Support Zone: $1720 to $1700
- 200 Day SMA – Green Line
- 50 Day SMA – Red Lin

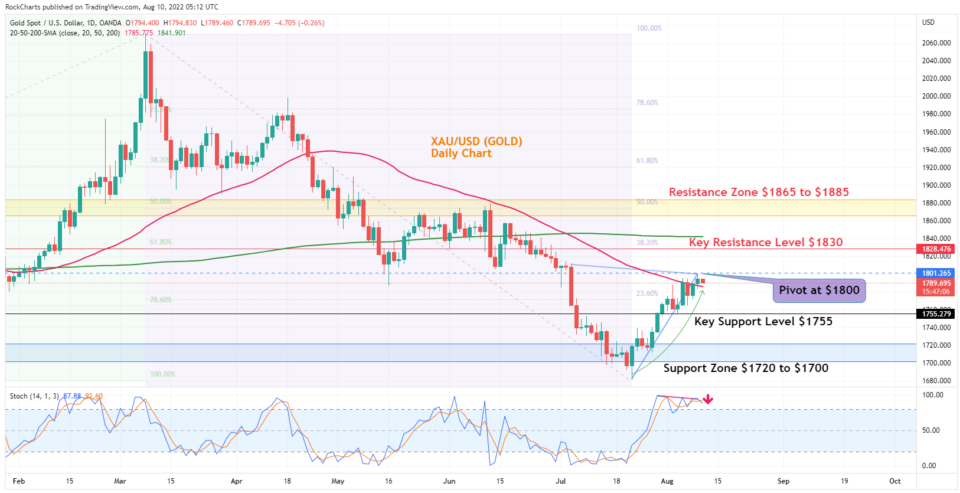
Chart Analysis:
The chart setup shows that the pair is sitting just under the Major Pivot point at $1800 currently a resistance level. Just about at this price point, Gold slipped sharply down on 5th July. And the selloff later brought prices down to hit the yearly low at $1681. At this stage, the pair is heading into the downtrend resistance and a breakout is needed to have a better idea of what direction the gold is going to take from here.
Daily Chart Directional bias - 2 Weeks
Trade Insights – XAU/USD – Chart shows Viable Short Positions below the Major Pivot Point at $1800, with the first target of the mild Support level at $1770 and then the test of the Key Support Level at $1755.
Alternatively, Long positions above the Major Pivot at $1800, with the first target to head towards the Key Resistance level at $1830 and then towards $1850 and beyond.