EUR/USD 4 Hour Chart
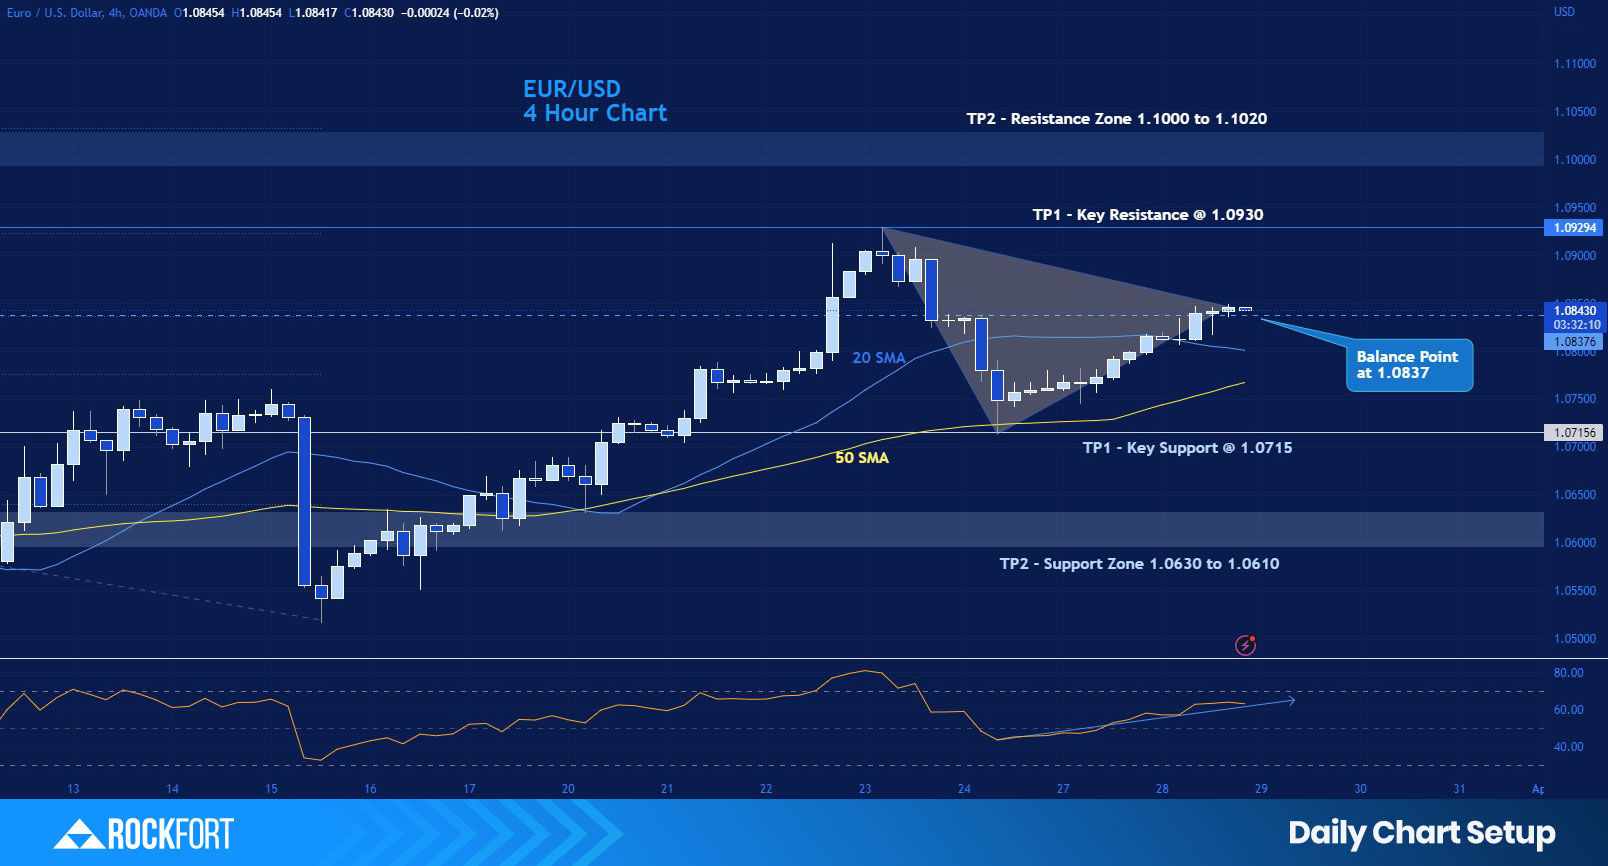
Chart Action Points
| Action: Potential buy positions above 1.0837 | Action: Potential sell positions below 1.0837 |
| Take Profit 1 (TP1) at 1.0930 | Take Profit 1 (TP1) at 1.0715 |
| Take Profit 2 (TP2) at 1.1000 | Take Profit 2 (TP2) at 1.0630 |
Comments
- An RSI of 63.50 points on a 4-hour EUR/USD chart suggests that the EUR/USD pair has been experiencing moderate buying pressure over the past 4 hours, but the momentum is not particularly strong. The RSI reading of 63.50 is above the 50 level, indicating that the pair is in bullish territory, but the fact that it is not higher suggests that the buying pressure is not particularly strong.
- The RSI signal line moving flat sideways suggests that the price of the pair may be consolidating or trading in a range. This indicates that the market may be taking a breather after a recent move up, and that traders may be waiting for more information before making further trading decisions.
- The 20 SMA is sloping slightly downwards indicates that the short-term momentum may be slowing down, and that there may be some bearish pressure building up. On the other hand, the fact that the 50 SMA is sloping upwards suggests that the long-term trend is still bullish, and that there is strong buying pressure underlying the market.
- Overall, the combination of a slightly downward sloping 20 SMA and an upward sloping 50 SMA suggests that the market may be experiencing some short-term consolidation or retracement, but the long-term bullish trend remains intact.
AUD/CAD 4 Hour Chart
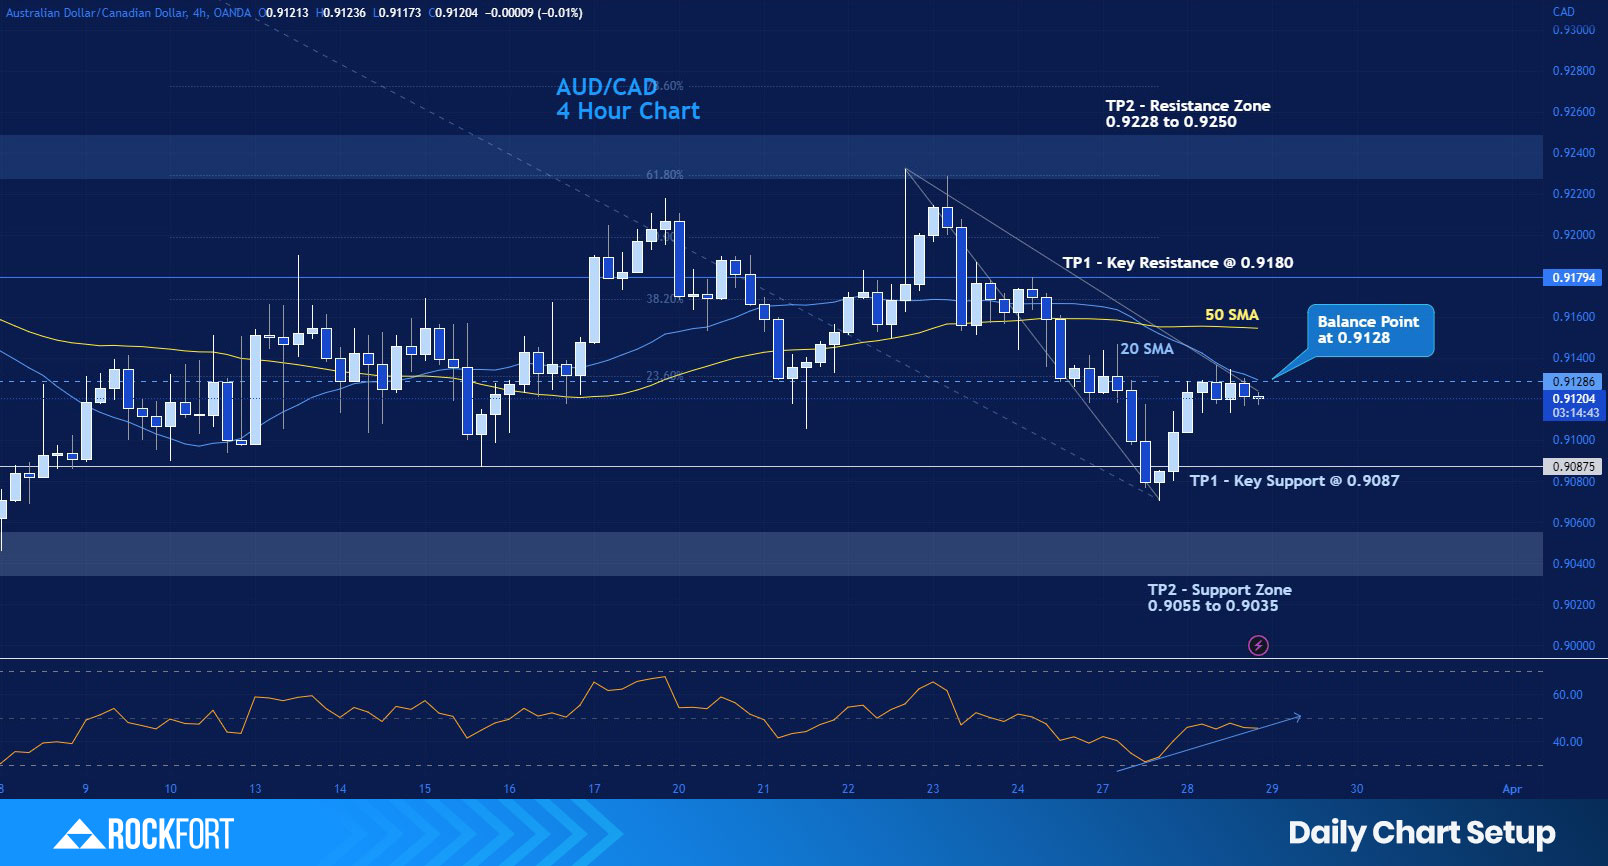
Chart Action Points
| Action: Potential buy positions above 0.9128 | Action: Potential sell positions below 0.9128 |
| Take Profit 1 (TP1) at 0.9180 | Take Profit 1 (TP1) at 0.9087 |
| Take Profit 2 (TP2) at 0.9228 | Take Profit 2 (TP2) at 0.9055 |
Comments
- An RSI of 46.00 points on a 4-hour AUD/CAD chart suggests that the AUD/CAD pair has been experiencing moderate selling pressure over the past 4 hours, but the momentum is not particularly strong. The RSI reading of 46.00 is below the 50 level, indicating that the pair is in bearish territory, but the fact that it is not lower suggests that the selling pressure is not particularly strong.
- The RSI signal line moving sideways suggests that the price of the asset may be consolidating or trading in a range. This indicates that the market may be taking a breather after a recent move up or down, and that traders may be waiting for more information before making further trading decisions.