USD/CHF 4 Hour Chart
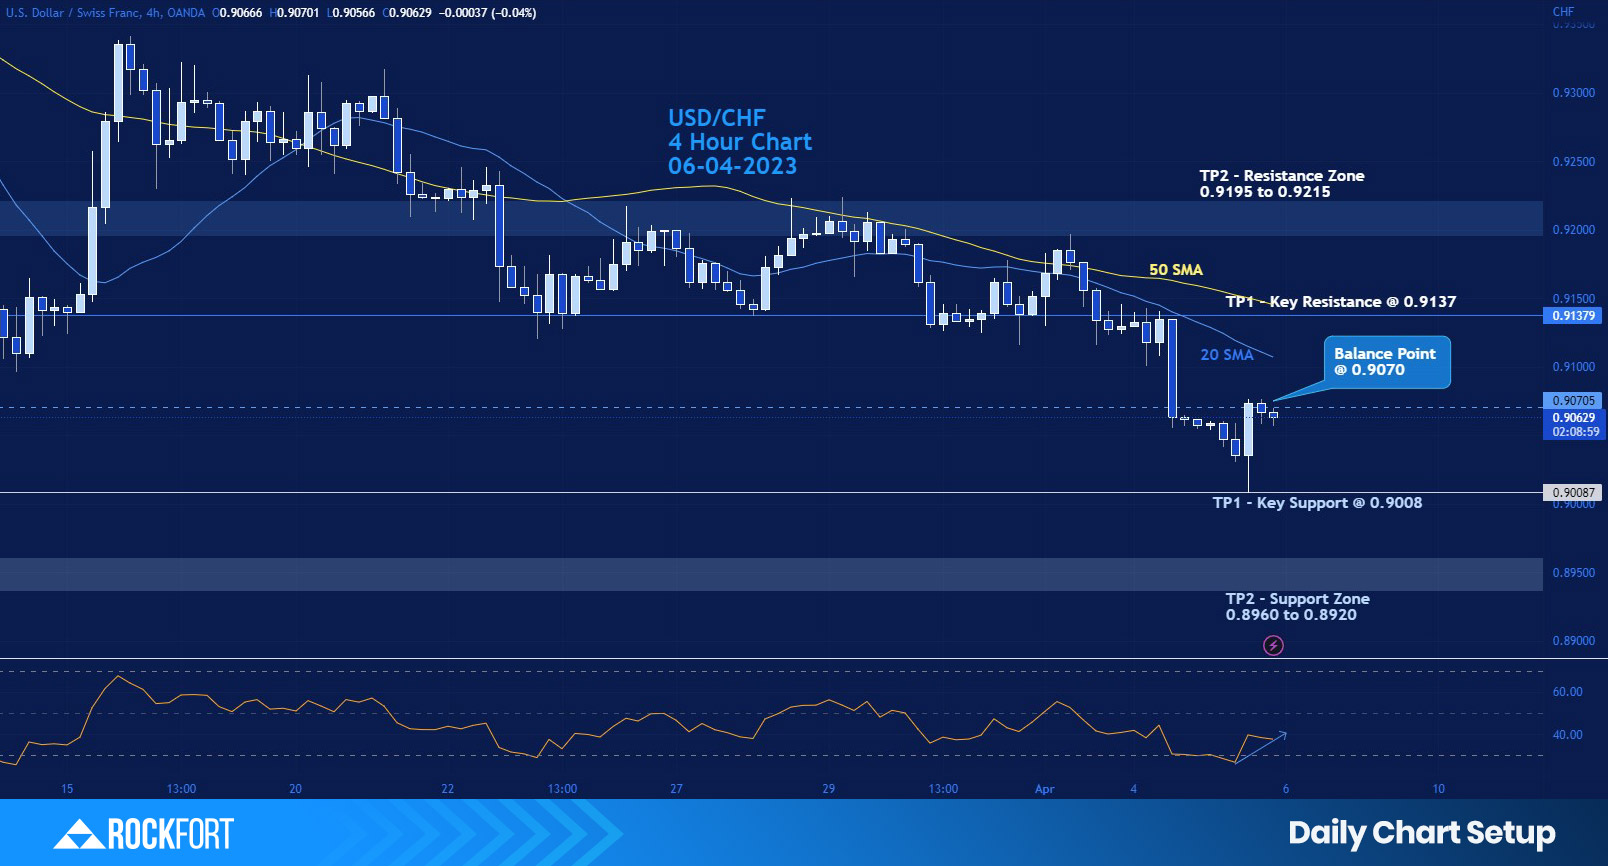
Chart Action Points
| Action: Potential buy positions above 0.9070 | Action: Potential sell positions below 0.9070 |
| Take Profit 1 (TP1) at 0.9137 | Take Profit 1 (TP1) at 0.9008 |
| Take Profit 2 (TP2) at 0.9195 | Take Profit 2 (TP2) at 0.8960 |
Comments
- An RSI of 37.70 points on a 4-hourly chart of USD/CHF suggests that the USD/CHF pair has been experiencing significant selling pressure over the past 4 hours. The RSI reading of 37.70 is below the 50 level, indicating that the pair is in bearish territory.
- The fact that the RSI signal line is sloping downwards suggests that the selling pressure is likely to continue in the near future.
- The 20 SMA is dropping down and the 50 SMA is sloping downwards on a chart suggests that the asset is experiencing a strong downtrend. Additionally, the fact that prices are trading below the 20 SMA suggests that the pair is experiencing selling pressure.
NZD/USD 4 Hour Chart
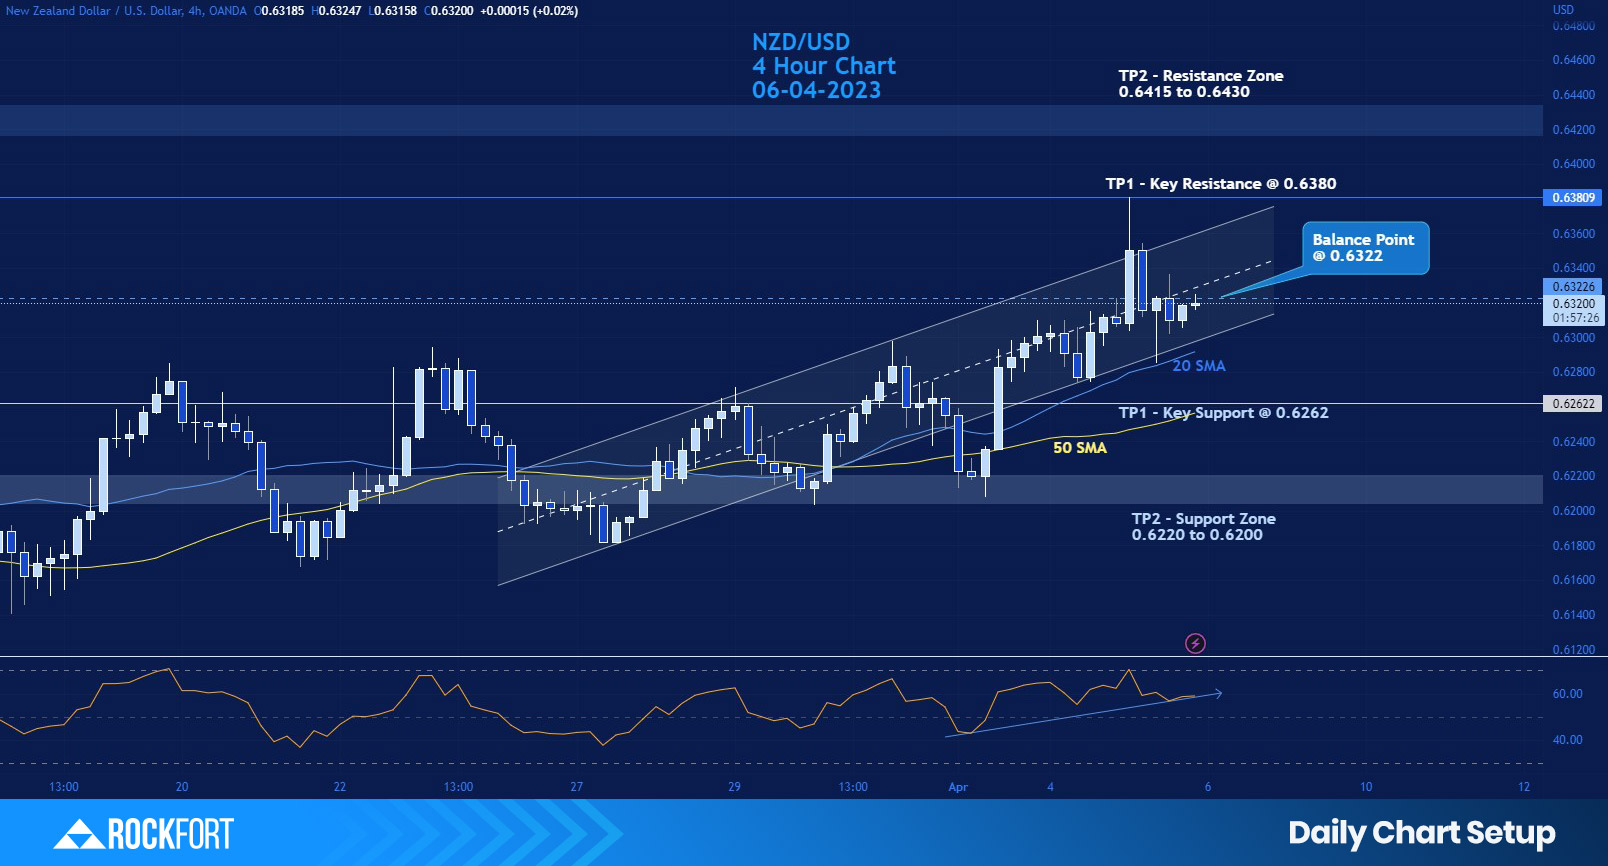
Chart Action Points
| Action: Potential buy positions above 0.6322 | Action: Potential sell positions below 0.6322 |
| Take Profit 1 (TP1) at 0.6380 | Take Profit 1 (TP 1) at 0.6262 |
| Take Profit 2 (TP 2) at 0.6415 | Take Profit 2 (TP 2) at 0.6220 |
Comments
- An RSI of 59.35 points on a 4-hourly chart of NZD/USD suggests that the NZD/USD pair is experiencing some bullish momentum. The RSI reading of 59.35 is above the 50 level, indicating that the pair is in bullish territory.
- The fact that the RSI signal line is sloping upwards suggests that the bullish momentum is likely to continue in the near future.
- When the 20 SMA is moving upwards and the 50 SMA is following the course, it indicates that the asset is experiencing an uptrend. Additionally, the fact that prices are trading above the 20 SMA suggests that the asset is experiencing buying pressure.