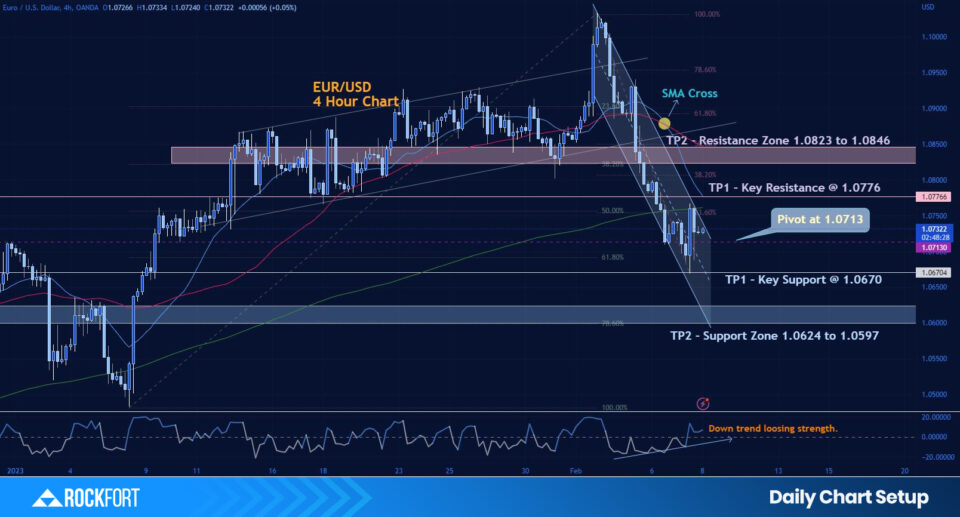
EURUSD 4 Hour Chart

Chart Action Points - EURUSD 4 Hour Chart
| Action: Potential buy positions above 1.0713 | Action: Potential sell positions below 1.0713 |
| Take Profit 1 (TP1) at 1.0776 | Take Profit 1 (TP1) at 1.0670 |
| Take Profit 2 (TP2) at 1.0823 | Take Profit 2 (TP2) at 1.0624 |
Comments
- The Relative Strength Index (RSI) Divergence Indicator suggests downtrend is weakening.
- SMA Cross - A potential indication of bearish price action is seen when the 20 Simple Moving Average (SMA) crosses below the 50 SMA, and when the 50 SMA crosses below the 200 SMA.
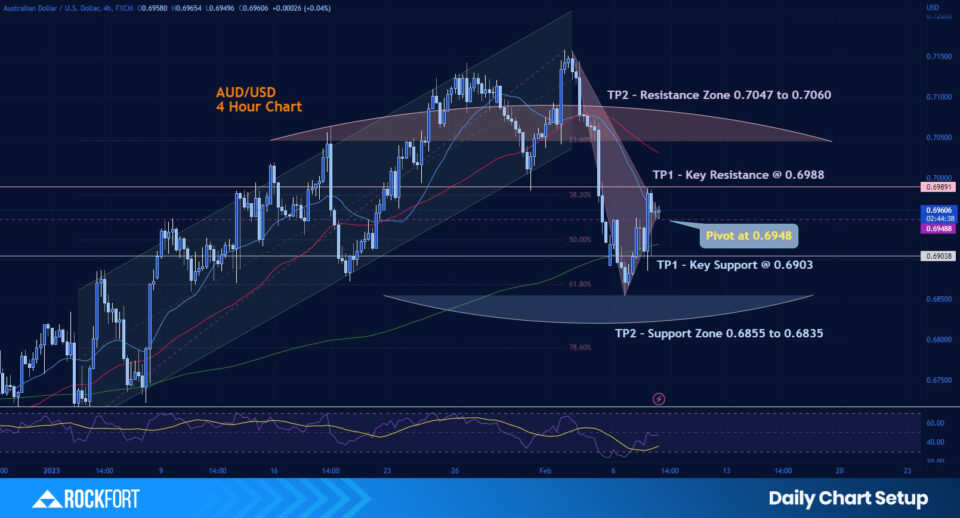
AUD/USD 4 Hour Chart

Chart Action Points - AUD/USD 4 Hour Chart
| Action: Potential buy positions above 0.6948 | Action: Potential sell positions below 0.6948 |
| Take Profit 1 (TP1) at 0.6988 | Take Profit 1 (TP1) at 0.6903 |
| Take Profit 2 (TP2) at 0.7047 | Take Profit 2 (TP2) at 0.6855 |
Comments
- RSI indicator moving upwards and about to cross the midline indicating bullish bias of the market.
- It is possible for prices to recover and rise from the triangle's apex point on the chart