USD/JPY 4 Hour Chart

Chart Action Points
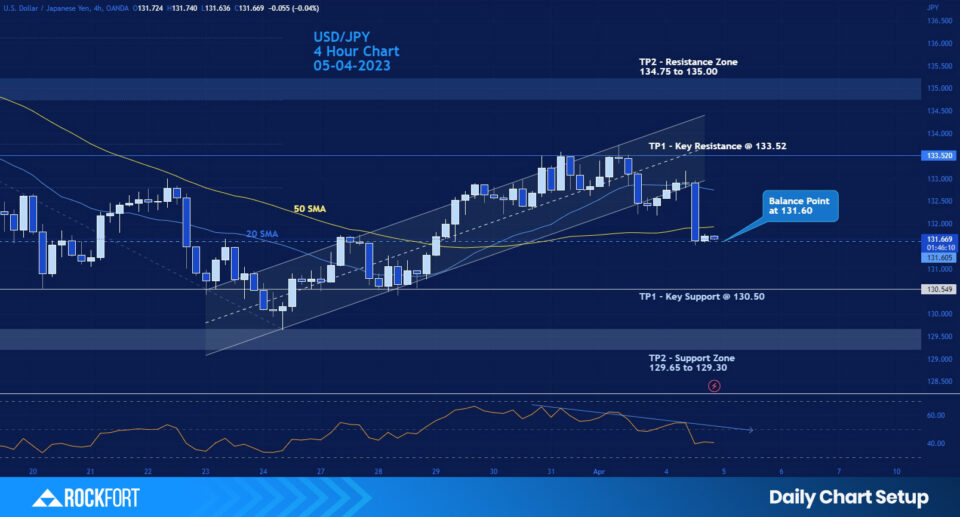
| Action: Potential buy positions above 131.60 | Action: Potential sell positions below 131.60 |
| Take Profit 1 (TP1) at 133.52 | Take Profit 1 (TP1) at 130.50 |
| Take Profit 2 (TP2) at 134.75 | Take Profit 2 (TP2) at 129.65 |
Comments
- An RSI of 39.66 points on a 4-hourly chart of USD/JPY chart suggests that the USD/JPY pair has been experiencing some selling pressure over the past few sessions and that the momentum is relatively weak. The RSI reading of 39.66 is below the 50 level, indicating that the pair is in bearish territory.
- The fact that the RSI signal line is sloping downwards suggests that the selling pressure is likely to continue in the near future.
AUD/CAD 4 Hour Chart

Chart Action Points
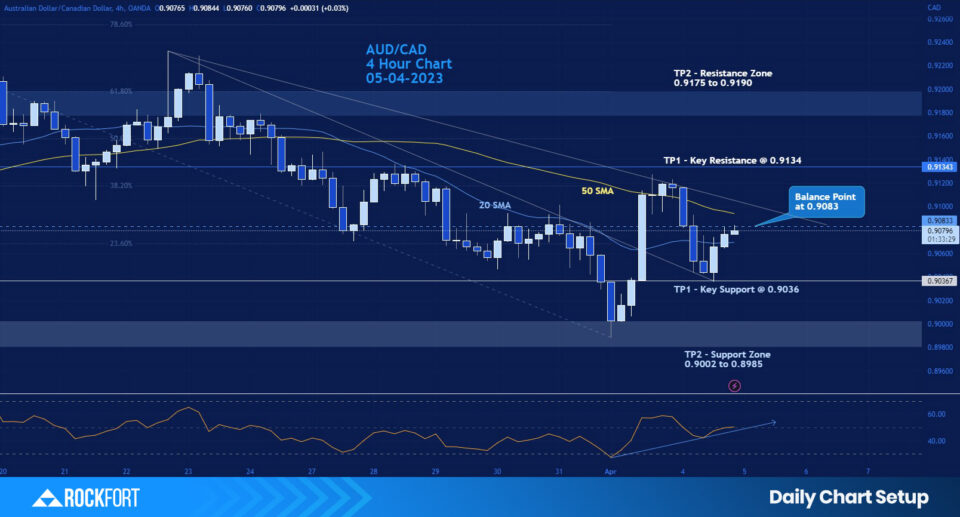
| Action: Potential buy positions above 0.9083 | Action: Potential sell positions below 0.9083 |
| Take Profit 1 (TP1) at 0.9134 | Take Profit 1 (TP 1) at 0.9036 |
| Take Profit 2 (TP 2) at 0.9175 | Take Profit 2 (TP 2) at 0.9002 |
Comments
- An RSI of 50.50 points on a 4-hourly chart of AUD/CAD chart suggests that the AUD/CAD pair is currently in a neutral state, with neither the bulls nor the bears having a significant advantage. The RSI reading of 50.50 is right at the 50 level, indicating that the asset is not strongly bullish or bearish.
- The fact that the RSI signal line is moving upwards suggests that the momentum may be turning slightly bullish. However, it's important to remember that technical indicators are not infallible and can sometimes provide false signals.