GBP/USD 4 Hour Chart
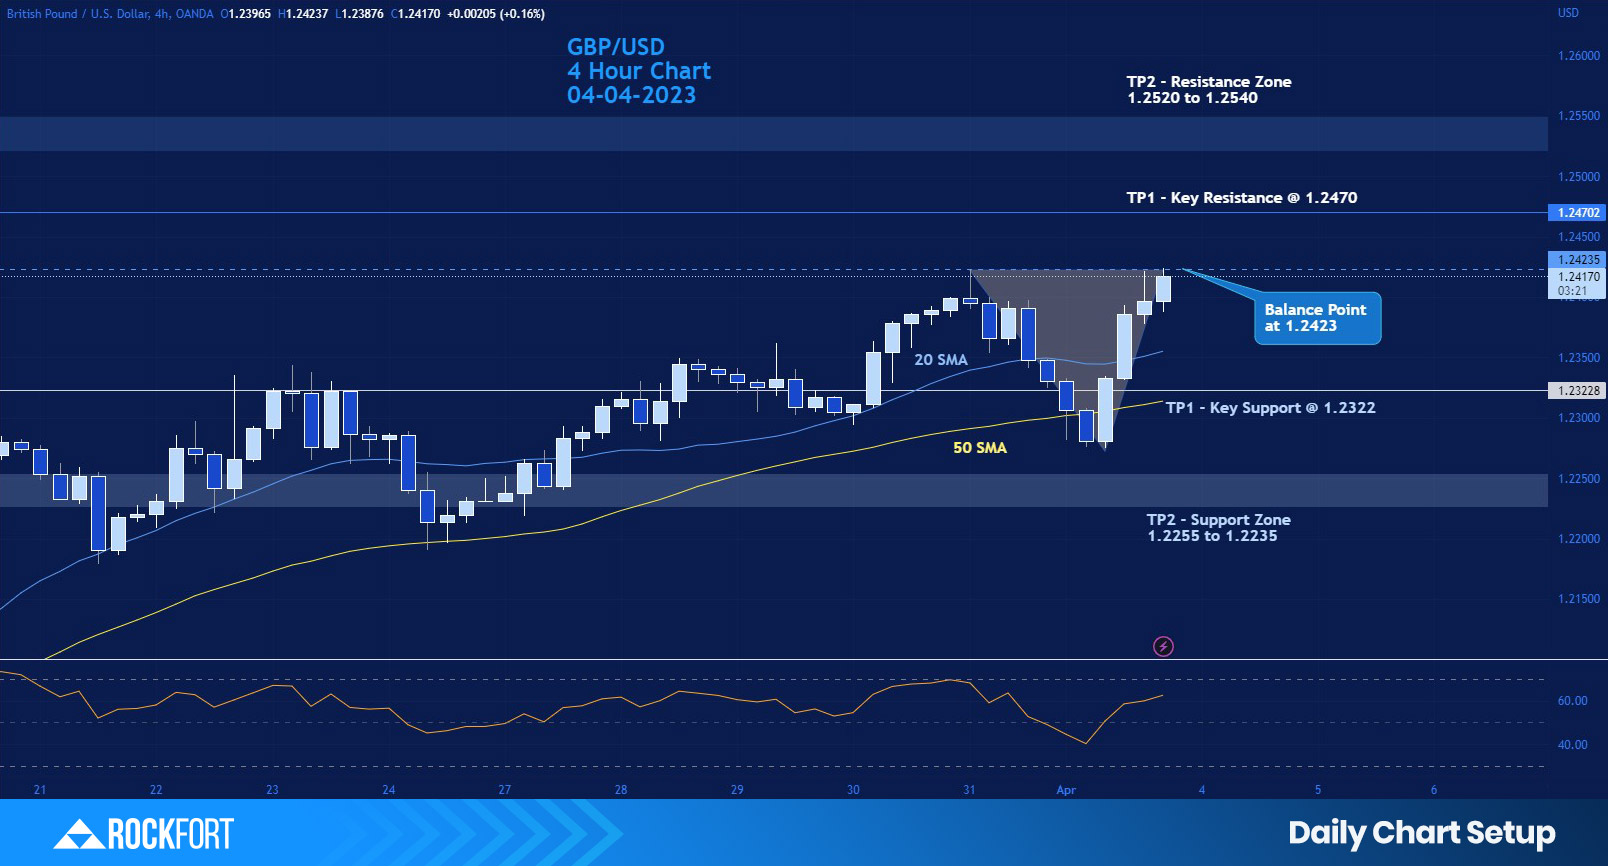
Chart Action Points
| Action: Potential buy positions above 1.2423 | Action: Potential sell positions below 1.2423 |
| Take Profit 1 (TP1) at 1.2470 | Take Profit 1 (TP1) at 1.2322 |
| Take Profit 2 (TP2) at 1.2520 | Take Profit 2 (TP2) at 1.2255 |
Comments
- An RSI of 63 points on a 4-hour GBP/USD chart suggests that the GBP/USD pair has been experiencing moderate buying pressure over the past few sessions, and that the momentum is relatively strong. The RSI reading of 63 is above the 50 level, indicating that the asset is in bullish territory, and the fact that it has bounced back up from 40 points in the past few sessions suggests that the buying pressure is strengthening.
- The fact that the RSI signal line is moving upwards is a bullish signal, indicating that the buying pressure is likely to continue in the near future. This suggests that the price of the pair may continue to rise in the short term.
EUR/USD 4 Hour Chart
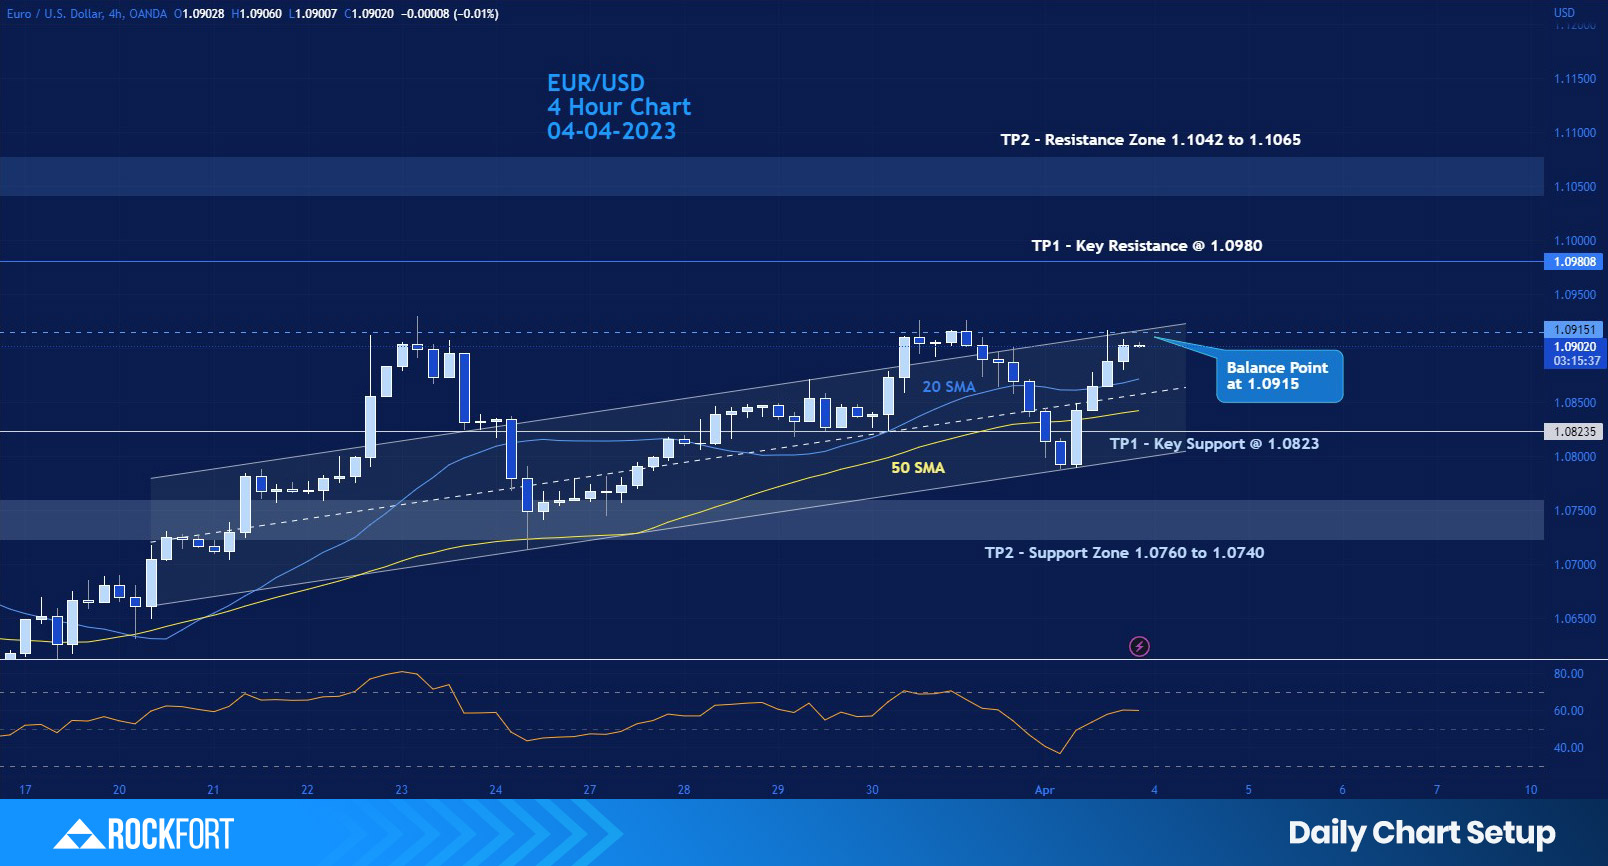
Chart Action Points
| Action: Potential buy positions above 1.0915 | Action: Potential sell positions below 1.0915 |
| Take Profit 1 (TP1) at 1.0980 | Take Profit 1 (TP 1) at 1.0823 |
| Take Profit 2 (TP 2) at 1.1042 | Take Profit 2 (TP 2) at 1.0760 |
Comments
- An RSI of 60 points on a 4-hourly frame EUR/USD chart suggests that the EUR/USD pair has been experiencing some buying pressure over the past few sessions, but the momentum is not particularly strong. The RSI reading of 60 is above the 50 level, indicating that the asset is in bullish territory, but the fact that it has bounced back up from 37 points in the past few sessions suggests that the buying pressure is not very strong.
- The fact that the RSI signal line is sliding sideways indicates that the momentum is not particularly strong in either direction. This suggests that the price of the pair may remain relatively stable in the short term.