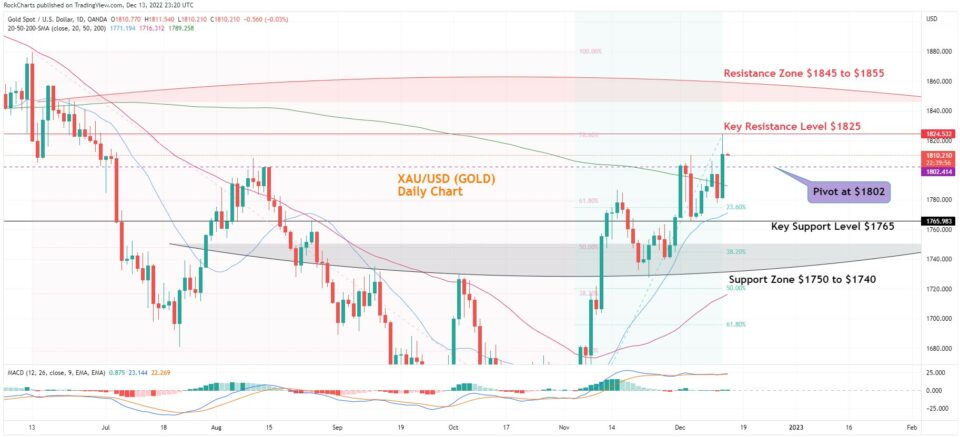
Chart Analysis: Gold jumped up yesterday by 1.63% to touch $1824 then later dropped down to settle at $1810 and making a fresh 5-month high and creating a high wick candle on the chart. Apparently, the tide has turned in the bull's favour and Gold has now recovered by almost 45% of the 2022 Sell-off.
The gold chart shows that the pair jumped up by $28 or 1.64% yesterday and now already testing the July month's peak before the Gold dropped sharply on 5th July due to the high inflation print. The jump was pushed by the dropping dollar from 105 to under 104. The pair is not making higher highs and lower lows moving to test the longer-term resistances on the chart.
The 20-day SMA is rising to catch up with the prices and is followed by the 50-day SMA. The 200 Day SMA has also dropped below the prices indicating a full bullish bias of the markets. The MACD indicator line is still trading in the overbought zone staying above the signal line. As soon as the blue indicator line moves below the orange signal line and starts to part away would signal a Sell off on Gold.
Daily Chart Directional bias - 1 Week
- Resistance Zone: $1845 to $1855
- Key Resistance Level: $1825
- Major Pivot Point: $1802
- Key Support Level: $1765
- Support Zone: $1750 to $1740
- 200 Day SMA – Green Line
- 50 Day SMA – Red Line
- 20 Day SMA – Blue Line
Chart Trading Insights
Trade Insights – XAU/USD
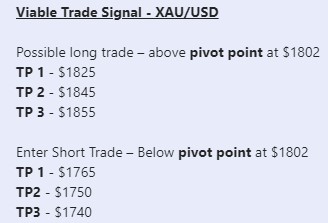
The chart shows viable long positions above the major pivot point at $1802 heading towards the first target of the key resistance level at $1825 and then the test of the key resistance zone between $1845 to $1855
Alternatively, possible short positions below the major pivot point at $1802 with the target of the key support level at $1765 then the test of the support zone between $1750 to $1740.

