The US30 CFD is an equity index tracking the performance of the top 30 blue-chip companies in the United States.
The US30 CFD index may seem similar to the more famous, Dow Jones index. The Dow Jones index is also known as the DJIA or the Dow Jones industrial average index. While the names may differ, both the US30 and the DJIA are basically the same with a few differences.
If you have been trading forex, you will find that your broker may offer the US30 CFD index. While this is not shown by default, you can explore the broker’s Symbols and find this index.
Since the US30 and the DJIA are basically the same, one may ask as to why have two names for the same financial instrument. This is where the similarity end and we go into a tangent about the world of CFD trading.
CFD or contracts for difference is a type of derivative instrument. It is synthetic in nature because the prices of the CFD contract are derived from the underlying asset that it tracks. This is how almost all the financial instruments with a broker who offers forex CFDs are traded.
But does this mean that the US30 is different? Are there any differences that you should bear in mind? Questions such as these and many more crop up due to the fact that the names are different.
As you will discover in the later parts of this article, the US30 CFD index offers some benefits which the DJIA does not. You will also learn some additional aspects such as the fees that you incur when trading the US30 index.
Without much further ado, let’s get into what the US30 index is in forex.
What is the US30 CFD Index?
The US30 CFD index is a CFD or a synthetic instrument, which derives its prices from the underlying asset that it tracks. In the case of the US30 index, this CFD tracks the performance of the Dow Jones industrial average.
The chart below shows a comparison between the US30 CFD index and the Dow Jones industrial average index.
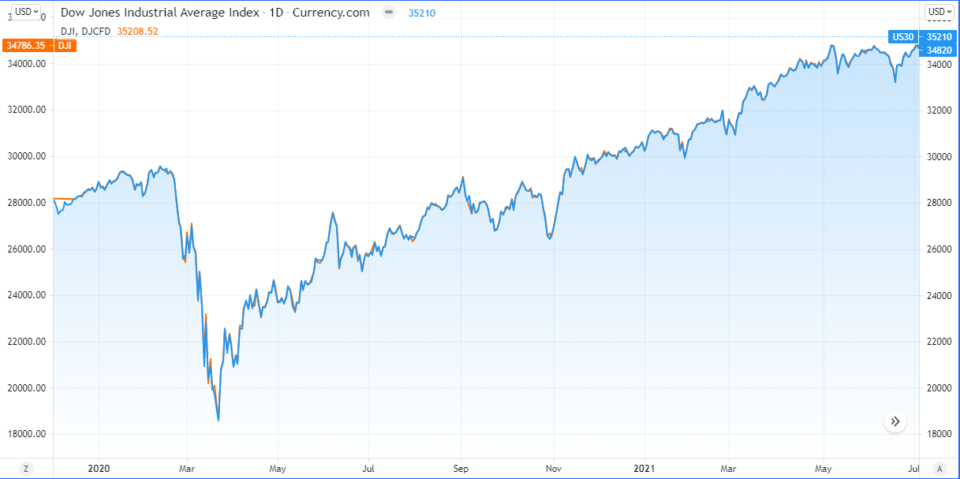
The US30 index is a CFD stock index tracking the prices of the Dow Jones 30. Whereas the DJIA is the stock index that makes up the underlying for the CFD index. In both cases, the prices are practically the same.
You will not see many differences when tracking the overall performance of both these financial instruments.
Thus, when you are trading the US30 CFD index, you are basically trading the Dow Jones industrial average, but through a CFD.
Since both the instruments are one and the same, you may wonder why trade the US30 when you can rather trade the DJIA index?
Well, the fact is that you cannot directly trade the Dow Jones Industrial Average index.
For that matter, you cannot trade any stock index directly.
The reason for this is because the DJIA is a stock index. A stock index is merely a barometer for the equity markets. It is used as a benchmark to measure the performance of a basket of equities.
In the case of the DJIA 30, the index tracks the performance of the 30 top blue-chip companies that are traded on the U.S. stock exchange.
Since traders cannot trade the actual stock index, they make use of derivatives. CFD’s are one way to access the stock index. You can also trade stock index futures as well, which works somewhat in the same way as the CFD.
What makes up the DJIA index?
Before going any further, we need to understand what the DJIA index is.
The Dow Jones industrial average is a very old stock market index. It was developed by Charles Dow, who was the editor of the Wall Street Journal. Hence, it got its name as the Dow Jones index, or the Wallstreet 30 index.
As the number in the title suggests, the Dow Jones index is made up of 30 companies. But they include just 29.
The companies that are listed on the Dow Jones 30 index are as follows:
| List of companies in the Dow Jones Index | ||||
| 3M | Chevron | Honeywell | McDonald's | Travellers |
| American Express | Cisco Systems | Home Depot | Merck | Unitedhealth |
| Amgen | Coca-Cola | IBM | Microsoft | Visa |
| Apple | Disney | Intel Corp | Nike | Walgreens |
| Boeing | Dow | Johnson & Johnson | Procter & Gamble | Wallmart |
| Caterpillar | Goldman Sachs | JP Morgan Chase | Salesforce |
The Dow Jones index is a stock weighted index since its inception, and this has not changed. Just as with other stocks, the Dow Jones index makes updates to the companies in its composition. Companies can be dropped, and new companies can be included in the index.
With the stock weighted average, the Dow Jones index signals the strength of the top 30 companies. These companies, as listed above come from different sectors and gives a broad indication of the U.S. stock market.
Because an index cannot be traded directly, there are different variations of this.
How to trade the Dow Jones?
The Dow Jones index can be traded using the following derivative instruments.
- CFD: The US30 CFD is the most common contract for difference. It tracks the Dow Jones prices and traders can go long and short. The US30 CFD is ideal for short term speculation. It attracts overnight financing costs if you keep your positions open over a prolonged period of time. CFD contracts are bilateral trades meaning that they are over-the-counter.
- Futures: The Dow Jones futures are financial contracts that are traded at a futures exchange. Using any of the futures exchange such as ICE or CME, you can trade the Dow Jones stock index futures. Typical futures contracts include the standard as well as the mini. The Dow Jones stock index futures are financially settled upon expiry as there is no delivery of the underlying contract. YM is the ticker symbol for Dow Jones futures
- ETFs: Exchange traded funds mimic the composition of the Dow Jones index. In other words, the Dow Jones ETF comprises of the 29 companies that are in the index. And together, the Dow Jones ETF tracks the prices of the main index. ETF’s are traded just like stocks meaning that they are settled at a stock exchange. There is an entry fee for purchasing the units in the Dow Jones ETF. There are many variations of the Dow Jones ETF, but the most famous is the SPDR Dow Jones industrial average ETF trust.
Using any of the financial instruments above, traders can gain exposure to the Dow Jones index.
Trading the Dow Jones on MT4
When it comes to trading the Dow Jones on MT4, the US30 is the symbol that you should look for.
If you do not find this symbol in your MT4 Marketwatch window, you can right-click on any symbol and select Symbols (Ctrl + U). This will open the Symbols list and from here you can navigate to the appropriate section.
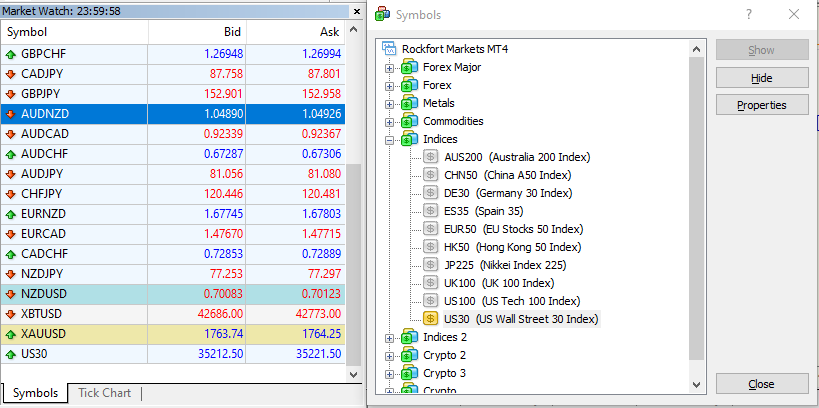
In the above example, the US30 CFD is listed under the Indices category. Depending on the broker that you trade with, this can change.
To learn about the symbol specifications for the US30, you can also click on the Properties button. This opens the contract specification details for the US30.
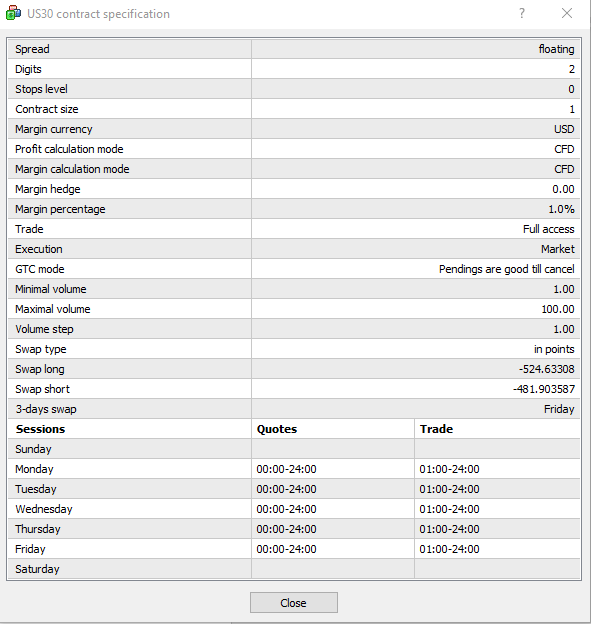
The symbol specifications outline more details like the type of instrument as well as the overnight financing costs. Note that there are negative overnight fees for both long and short on the Dow Jones CFD, US30 index.
The trading hours are also specified, which shows you the different times when you can trade the US30 index. You can also see the minimum and the maximum contract size that you can trade using the US30 CFD index on MT4.
Once the instrument shows up in your Marketwatch window, you can then add it to the chart and make use of any of the technical analysis methods you like.
Why should you trade the US30 index on MT4?
The US30 CFD index is a great way to access the US equity markets.
Typically, for investors outside of the US, it can be expensive to trade US equities. There are also various tax implications when trading instruments such as the Dow Jones ETF.
Using CFDs’s are simple and the US30 allows for an easy way to trade the leading stock market index of the United States.
Since CFD is traded on margin, the entry costs or the capital required is also lower. This allows anyone with a small capital to trade the Dow Jones index via the US30 index.
CFD’s also allows traders to go both long and short. Therefore, there are no additional costs. The only thing to bear in mind is that when leaving your positions open overnight, there are extra costs that you must pay.
However, for the most part, the US30 CFD index is mainly used for intraday trading. Since the index has a good level of volatility, there are many trading opportunities that one can take advantage of.
One aspect to bear in mind is that the volatility in the Dow Jones index picks up during the US trading hours. Therefore, you can find that the stock index remains almost flat during non-US trading hours such as the Tokyo session.
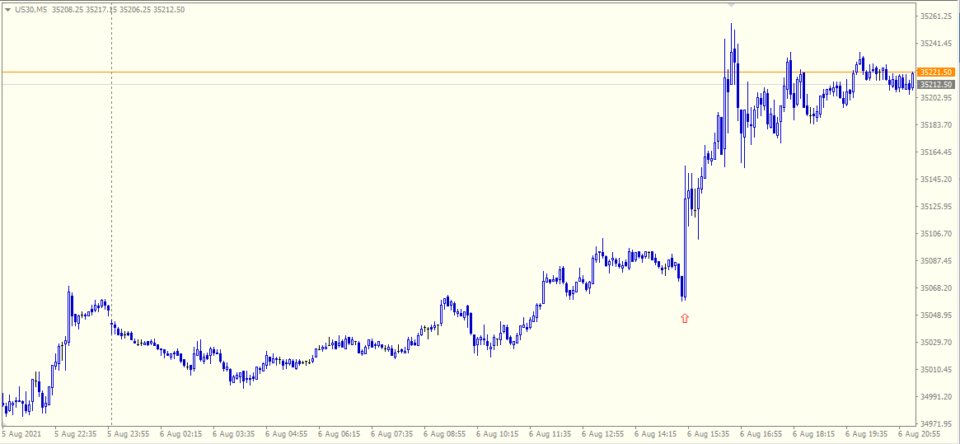
The above chart shows a 5-minute timeframe for the US30 index. The arrow that you see on the chart shows the start of the US trading session.
Comparing the period after this arrow and the prior period, you can see the difference. Price action is broadly flat before the U.S trading session open. Activity in the market picks up toward the start of the European trading session and eventually into the US trading session.
Fundamental factors that impact the US30 prices
While the US30 may seem similar to a forex in some ways, the fundamentals differ. Obvious by its name, the equity markets are influenced by factors such as interest rates, economic growth, regulation and so on.
Therefore, traders should pay attention to the news, especially during the U.S. trading session. Similar to forex, the Fed plays a big role in the stock market. Comments from FOMC members, interest rate speculation add to the volatility.
The Dow Jones index also signals the overall health of the company. Since there are 29 companies that are listed in the index, traders should pay attention to these as well.
Companies such as Apple, Microsoft, Visa, JP Morgan Chase, Johnson and Johnson are the top five companies in terms of market cap. Since these are constituents of the Dow Jones index, traders should keep a watch on these individual companies as well.
Earnings from each of the 29 companies listed on the Dow Jones index certainly plays a role in the price action for the US30 CFD.
Frequently asked questions about the US30 CFD index
Now that you know the US30 CFD index, we will address some of the most commonly asked questions about the US30 CFD Index. This will provide a summary of what we have learned in this article.
Can I trade US30?
Yes, anyone who has access to their broker can trade the US30. But remember that not all brokers offer CFD indices trading. Therefore, check with your broker who offers forex CFDs or visit their website to go through the list of instruments that are available for trading.
What is a pip on US30?
A pip is not the right term to use for US30. The correct naming convention is tick size. Similar to a pip, the tick size is the minimum price movement in the US30 stock index. For the US30, the minimum tick size is 0.1.
What is dollar value of the tick size for US30 CFD index?
To derive the dollar value, the tick size should be multiplied by 10. Hence if the price moves from 30,000 to 30,005, that is a movement of $5 or $50 in terms of dollar value. You can further drill down to getting the actual number of ticks that it has moved.
In this case, it would be a 500 point move.
What are the US30 trading hours?
The US30 CFD is available for trading 24 hours a day, five days a week. But as we mentioned earlier, the US30 CFD index loses volatility during the non-US trading session. Hence, prices may barely move during such periods.
Can I use the US30 for investing in US stock markets?
CFD’s are hedging instruments and thus not used for investing directly. Furthermore, the cost of overnight financing can get expensive. Traders use the US30 CFD stock index merely to hedge their bets, or for speculative trading. Therefore, the US30 stock index is more suited for day trading rather than long term investing.